$149.00
An integrated, institutional-grade blue ammonia financial model for an ammonia production plant using natural gas as feedstock, with carbon capture and storage and an in-built hydrogen production unit — three statements, a cash waterfall and complete lender metrics, built in Excel.
Blue ammonia has emerged as one of the more credible routes to a low-carbon fuel. Produced by combining hydrogen and nitrogen, with carbon capture technology mitigating the emissions from natural gas feedstock, it offers a transportable, storable alternative with applications spanning power generation and heavy transport. But its economics are genuinely intricate — feedstock price, carbon sequestration cost and ammonia price each pull the project in different directions, and the plant contains a hydrogen production unit inside it.
This blue ammonia financial model was built to hold all of that in one place. It helps organisations assess the financial viability of setting up and operating an ammonia production plant, capturing every essential input across construction, operation and financing — and resolving them into the metrics a developer, sponsor or lender needs to make a decision.
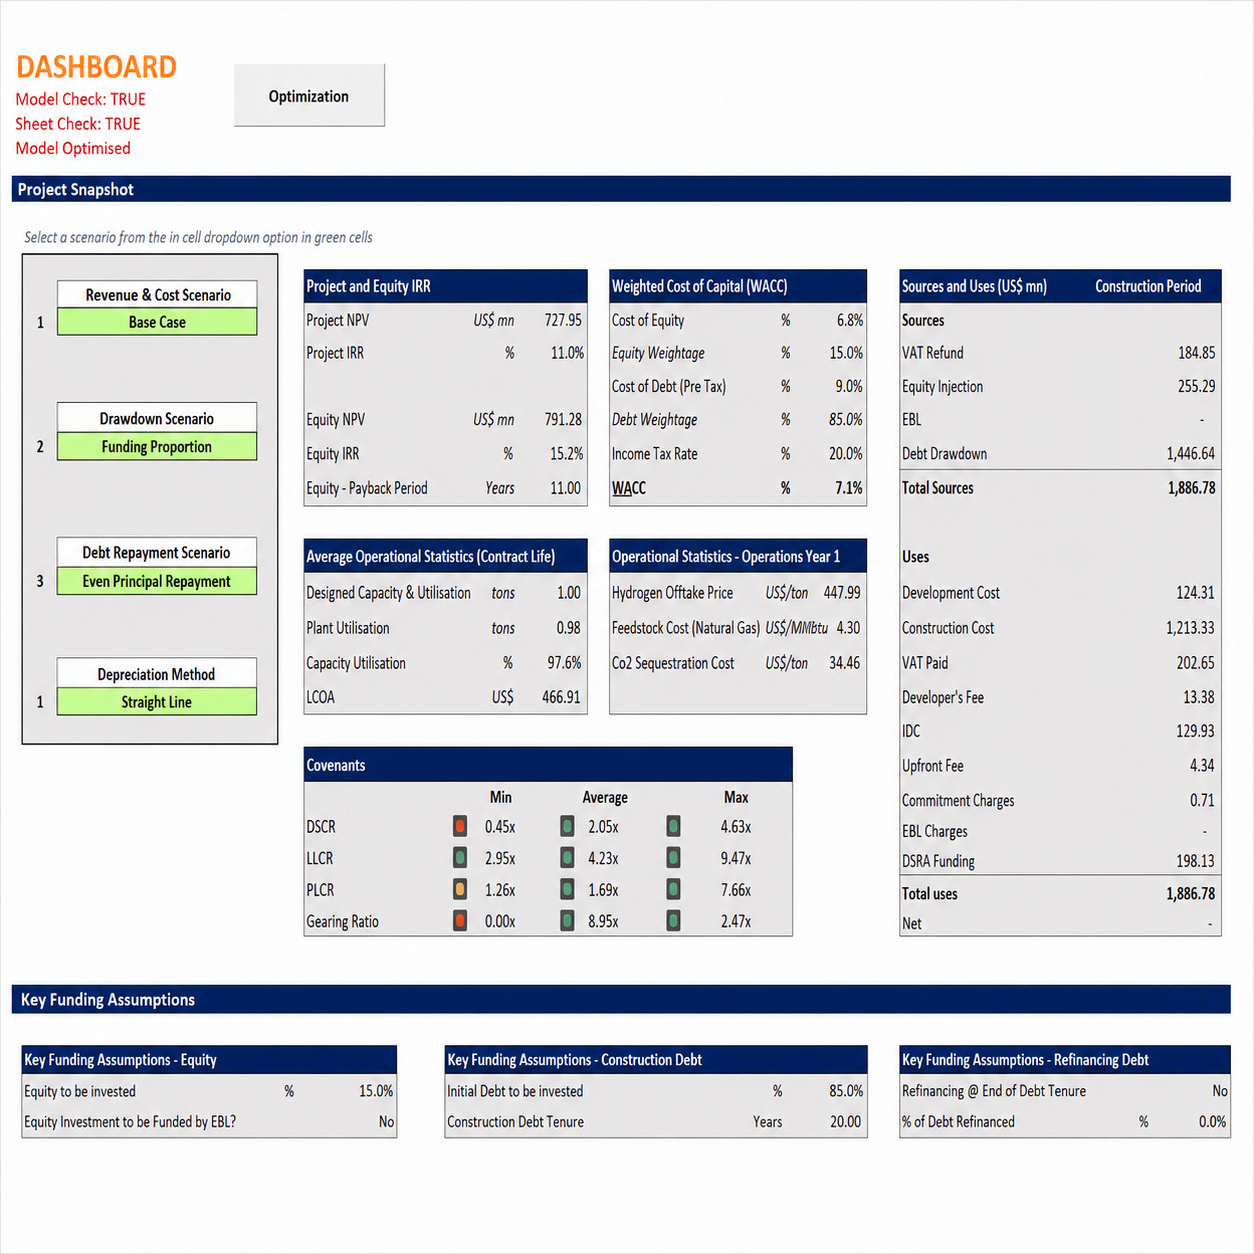
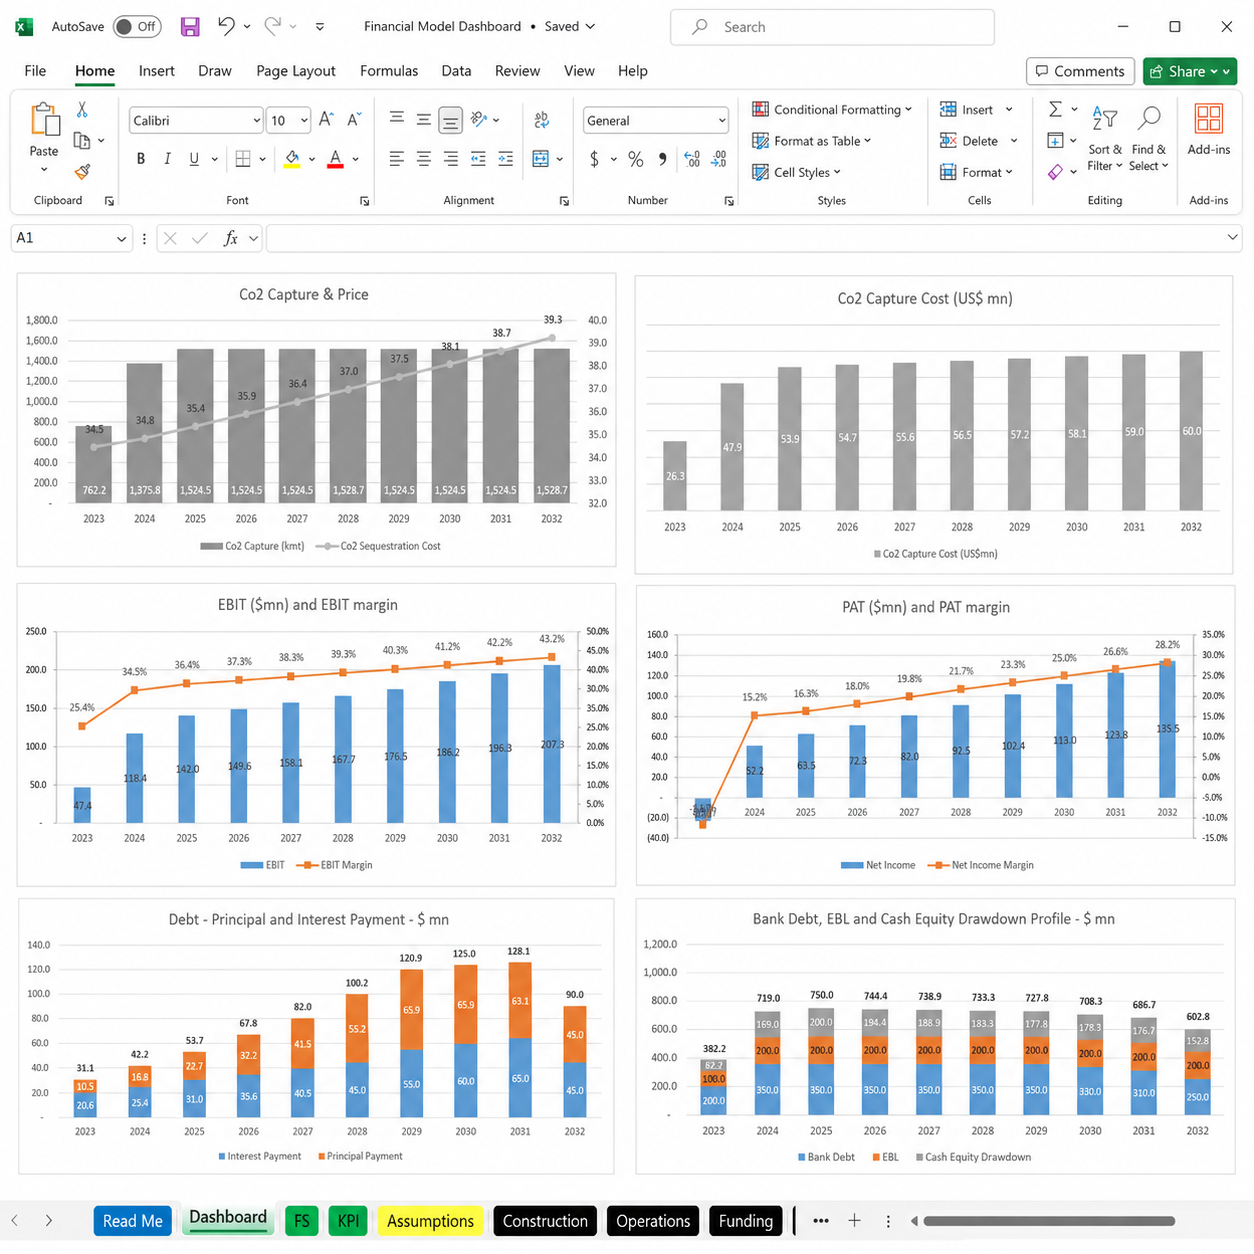
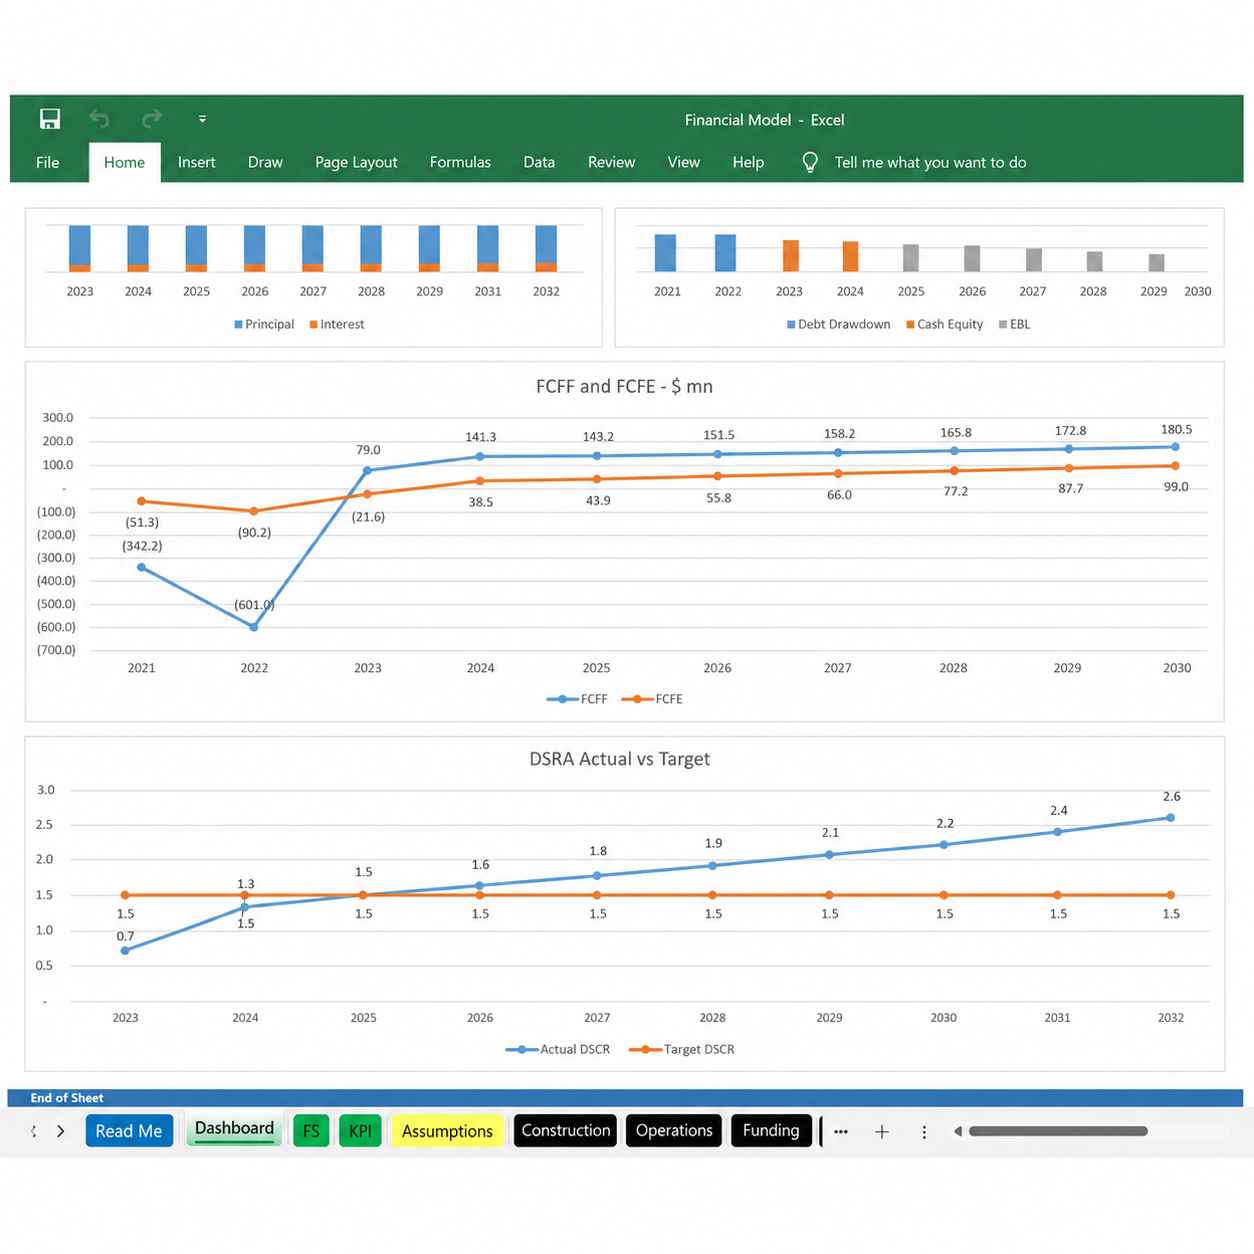
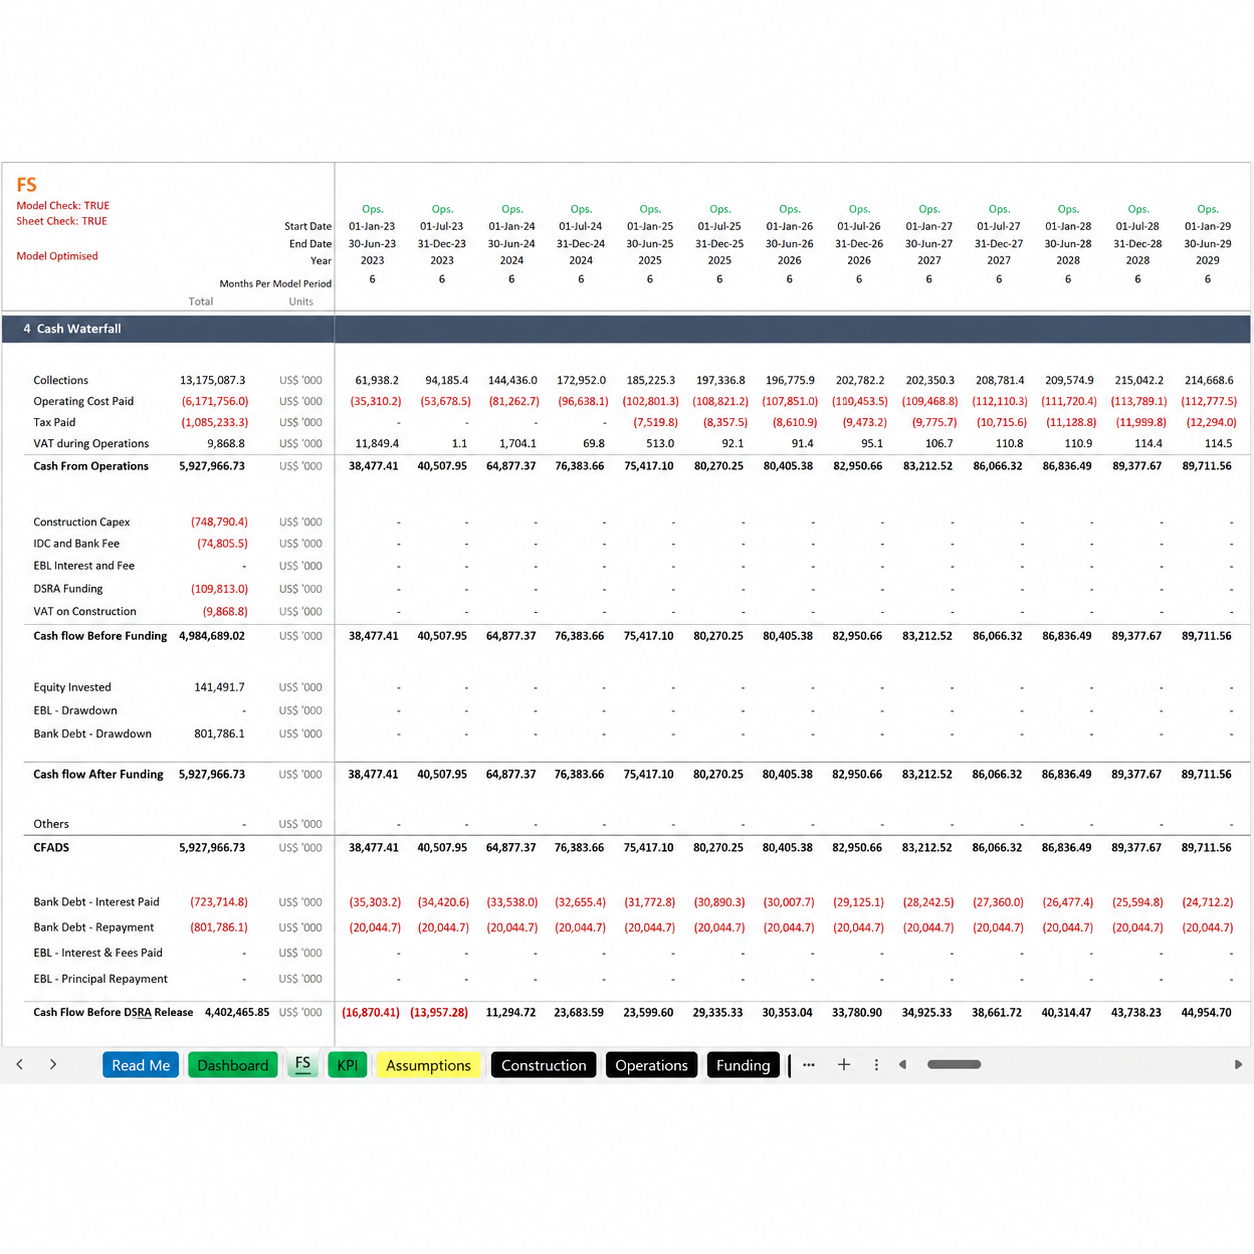
Alongside the standard project-finance suite — Project and Equity IRR and NPV, minimum and average DSCR, LLCR, PLCR, equity payback and a full cash waterfall — the model calculates the Levelised Cost of Ammonia (LCOA), the single figure that determines whether your plant can compete.
Returns tell you whether a project is worth building. The levelised cost tells you whether it can survive in the market. By spreading total lifetime cost across total lifetime output, LCOA gives you a single per-tonne figure to set against prevailing ammonia prices and competing production routes.
Because the blue ammonia financial model calculates LCOA from the same assumption set that drives the cash flows, you can watch it respond as you flex natural gas price, carbon capture efficiency or plant utilisation — the three variables that most often decide whether a blue ammonia project proceeds.
Every driver of viability is an explicit, editable input. The assumptions cover:
| Development & Construction | Development cost, construction cost and developer’s fee |
| Plant Capacity | Processing capacity and ammonia production volume |
| Revenue | Ammonia sales and other sources of revenue |
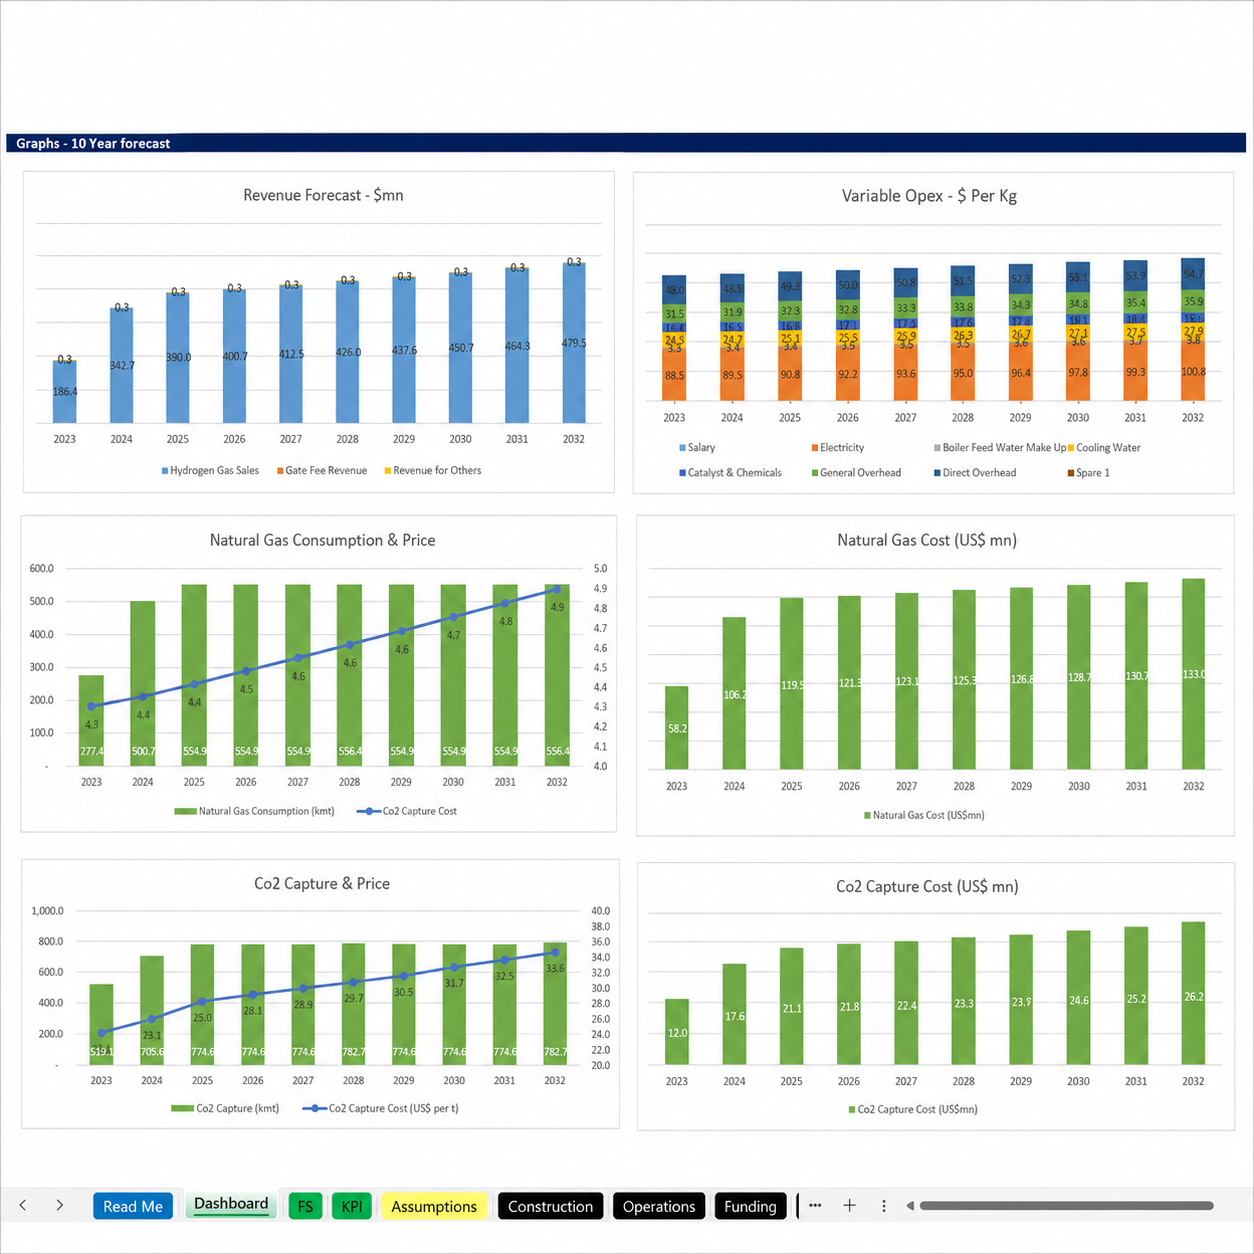
| Feedstock & Carbon | Natural gas feedstock cost and carbon sequestration cost |
| Variable O&M | Cost per tonne across eight subheads — salary, electricity, boiler feed water, cooling water, catalyst and chemicals and more |
| Fixed Costs | SPV cost, insurance, land lease, community payment, management fee and more |
| Funding Profile | Cash equity, bridge loan, bank debt, DSRA and bank overdraft |
| Debt Repayment | Annuity, sculpted and even-principal options |
| Adjustments | Inflation and indexation, VAT during construction and operations, depreciation options and working capital |
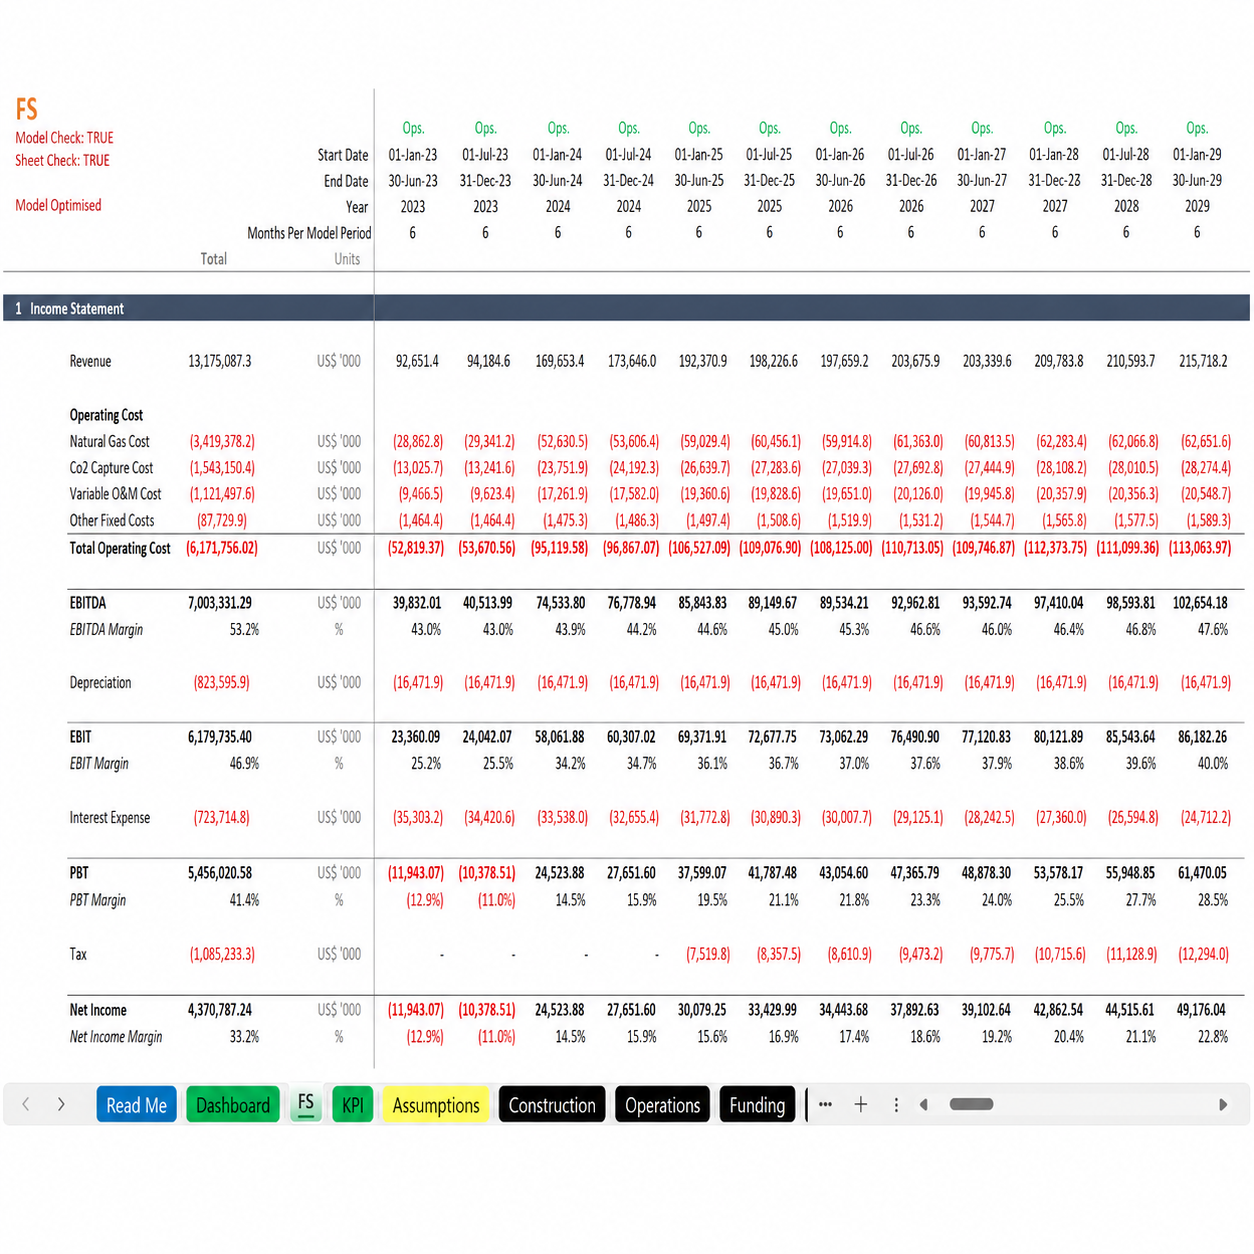
The model resolves your assumptions into the full set of metrics a financing decision turns on:
Every revenue and cost assumption can be entered across three scenarios and switched at a button, so base, upside and downside cases sit side by side. The debt funding drawdown carries three scenarios of its own — valuable when negotiating terms with financial institutions — and repayment can be profiled as annuity, even-principal or sculpted, each showing its impact on IRR immediately.
Sequestration cost is a separate driver, so you can test how CCS economics affect returns and levelised cost.
The levelised cost per tonne comes straight from the model, so you can benchmark against market prices instantly.
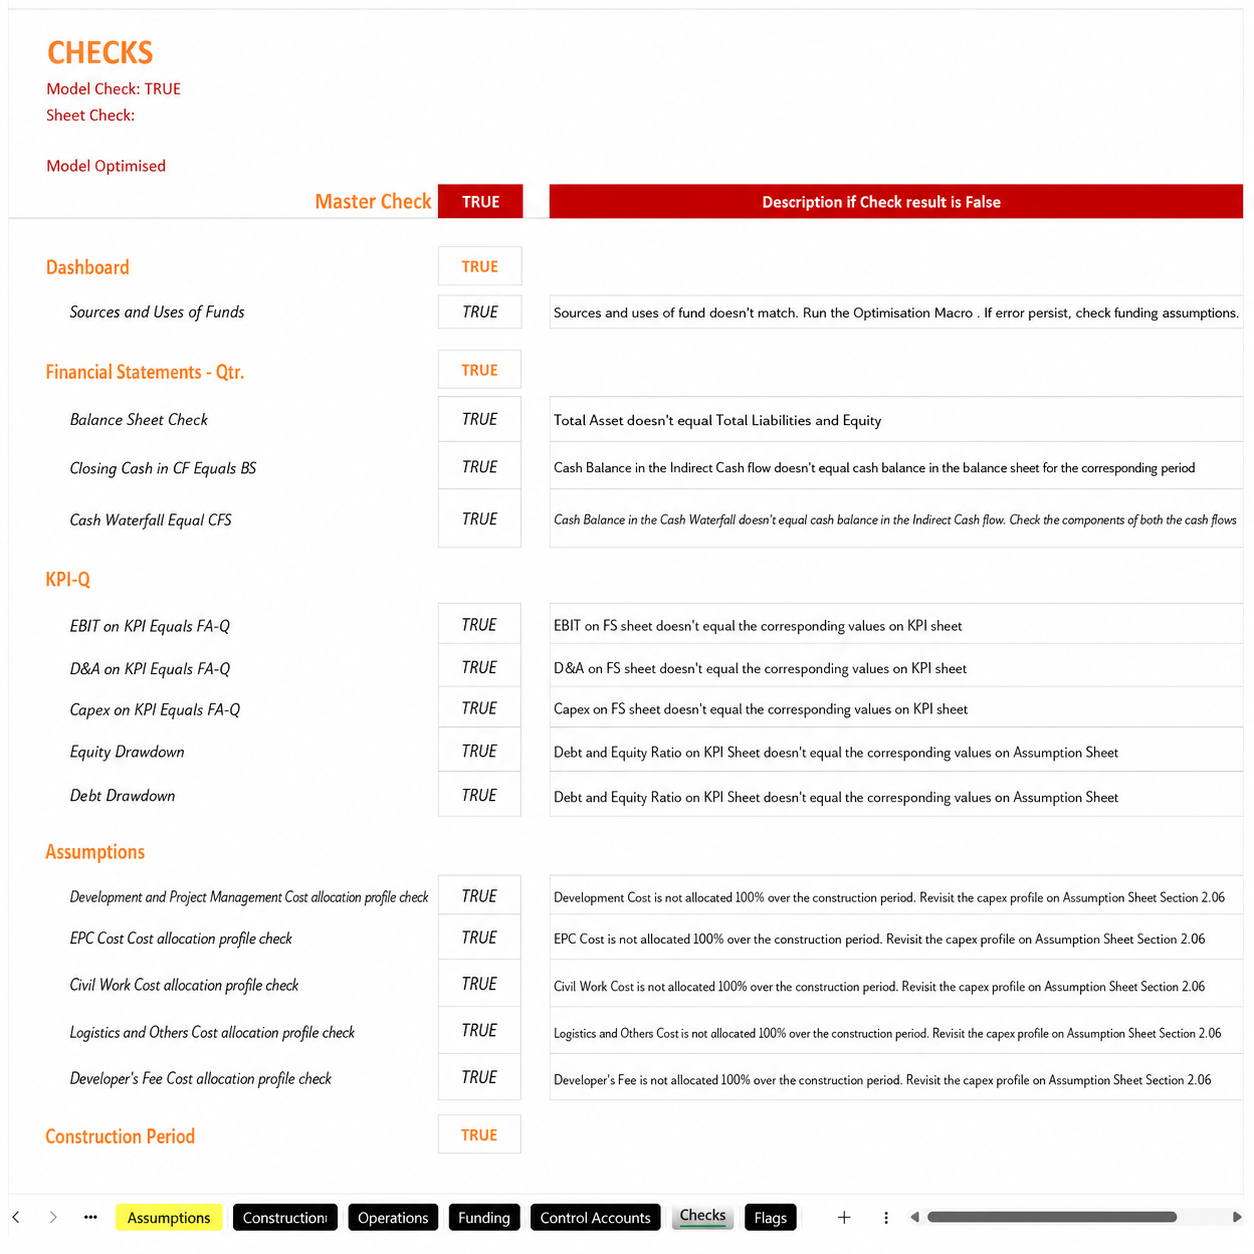
Clearly defined input, calculation and output cells, with a colour-coded heat map so even a first-time user can navigate it.
New to these metrics? Read an overview of the debt service coverage ratio. For a model built to your own specification, see our project finance advisory services, or browse the full range of PPP and project finance templates.
Natural gas feedstock, carbon capture, an in-built hydrogen unit, LCOA and every lender metric from Project IRR to LLCR — ready in Excel.