$149.00
A detailed, institutional-grade hydrogen sales financial model for assessing the feasibility of setting up and operating a hydrogen gas sales and tolling business — with tranche-level tolling fees, full indexation logic, three integrated statements and a cash waterfall, built in Excel.
Everyone talks about producing hydrogen. Far fewer have worked out how to sell it. Between an electrolyser and an end user sits an entire commercial layer — tolling arrangements, offtake contracts, bulk breaking and the tariff you charge — and that layer is a business in its own right, with its own capital requirements and its own returns. It is also where a great many hydrogen ventures discover their economics do not work.
This hydrogen sales financial model exists for exactly that question. If you are entering the hydrogen space and want to know whether a gas sales and tolling business is genuinely profitable, the model captures volumes, tolling fees, gas pricing and the full cost stack — and resolves them into the metrics that tell you whether the venture stands up.
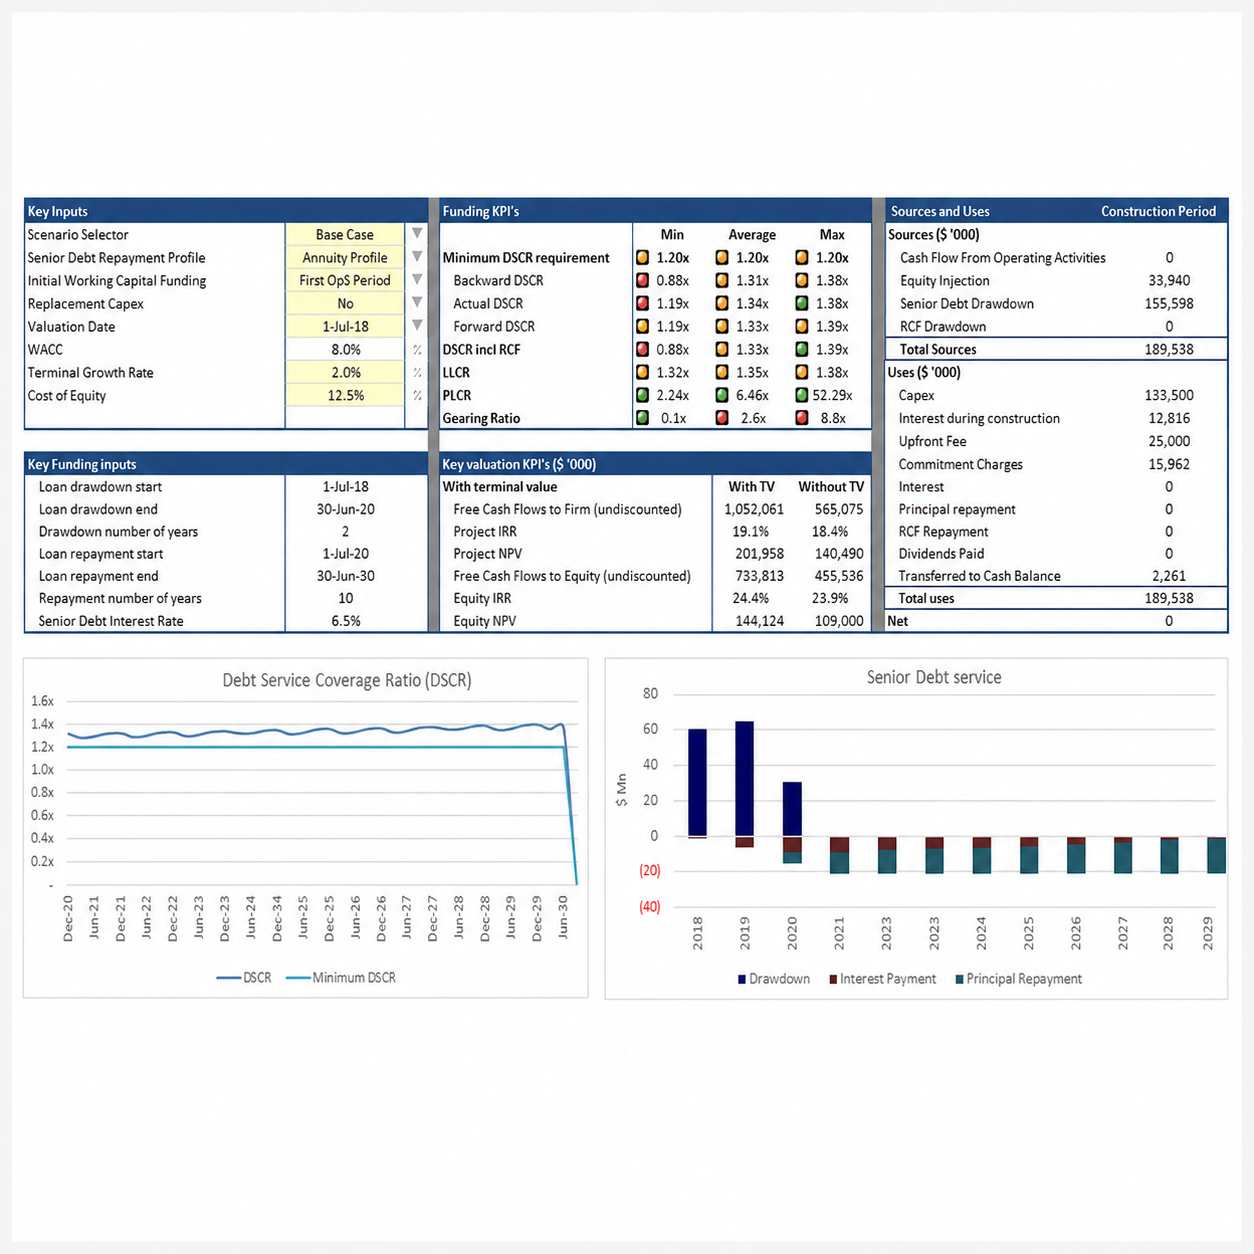
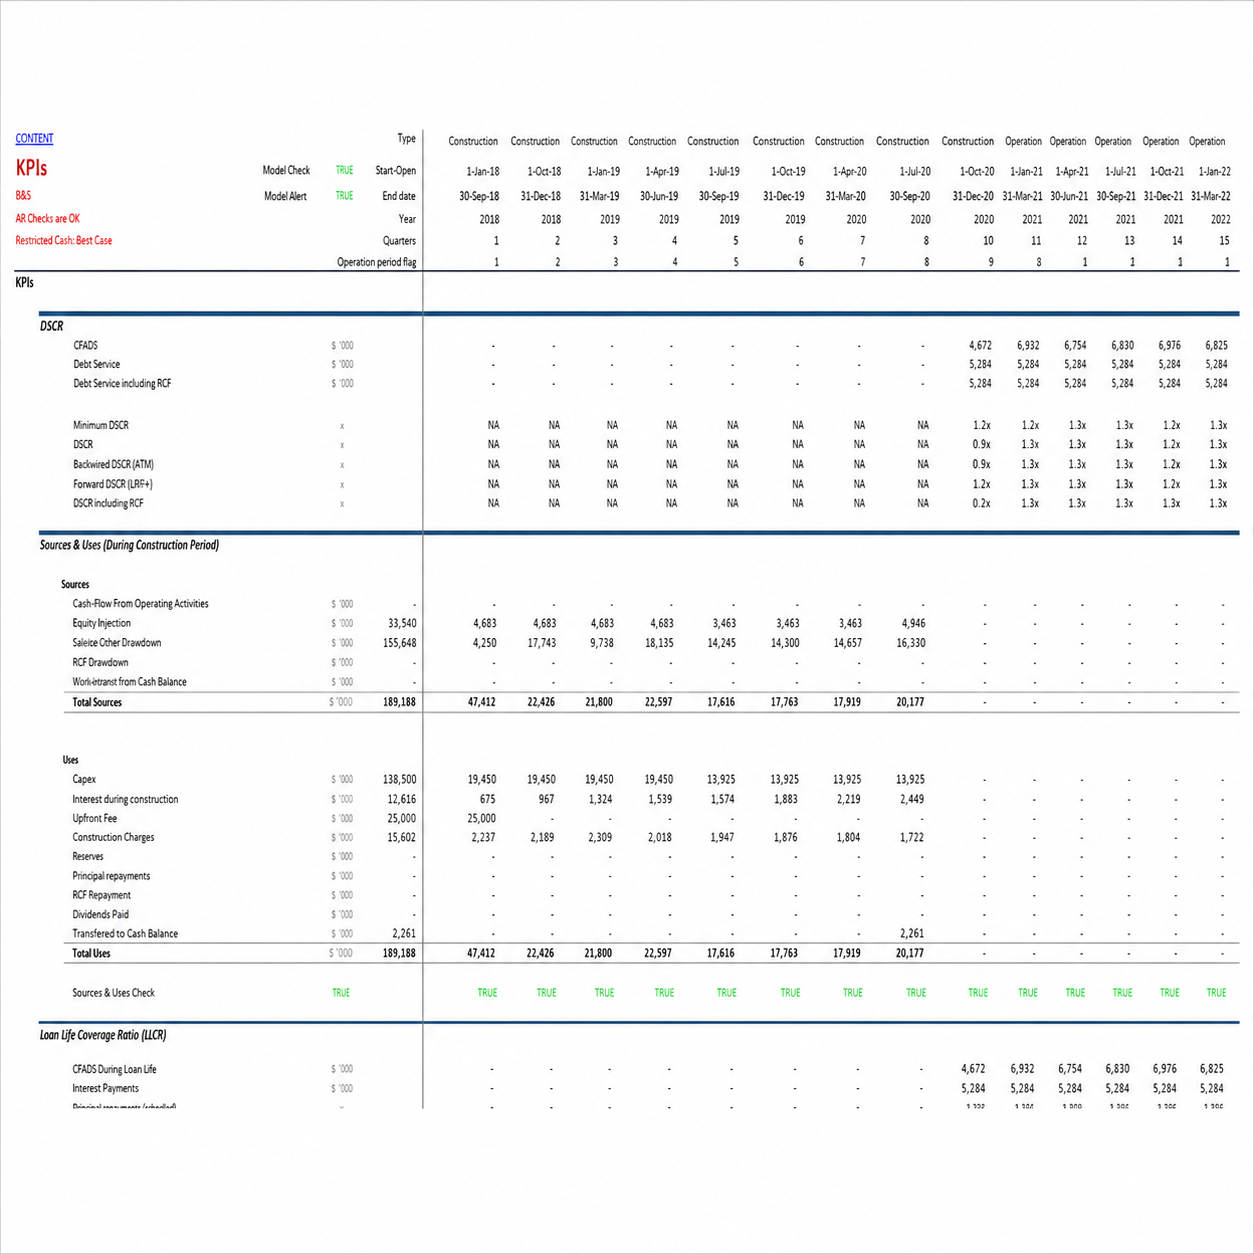
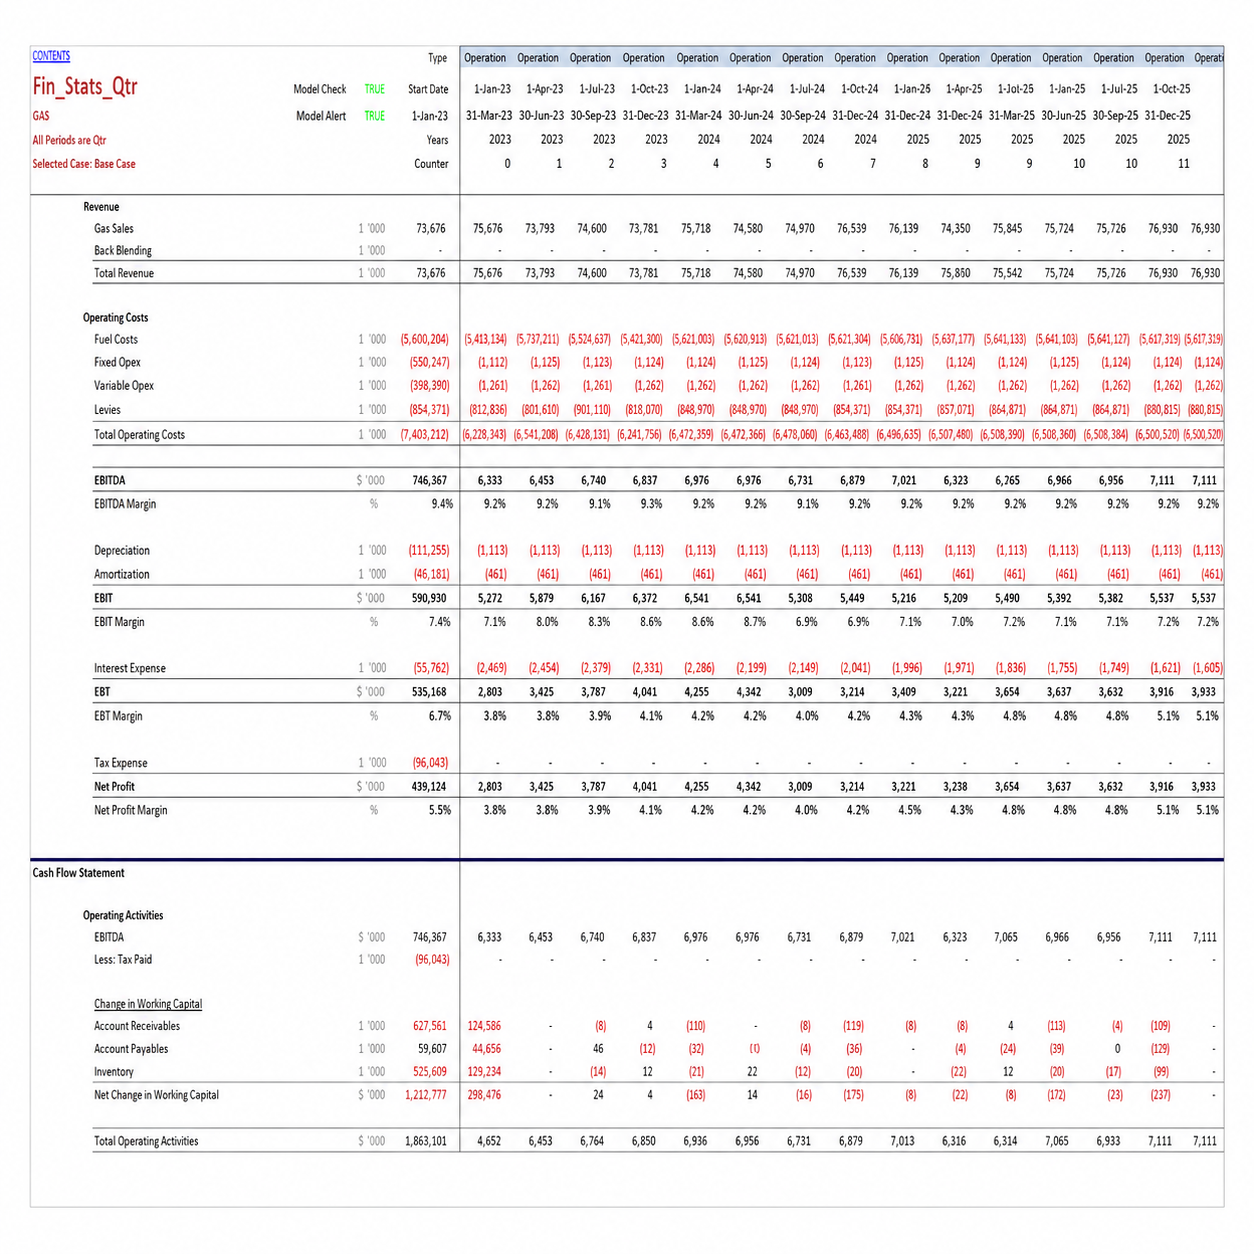
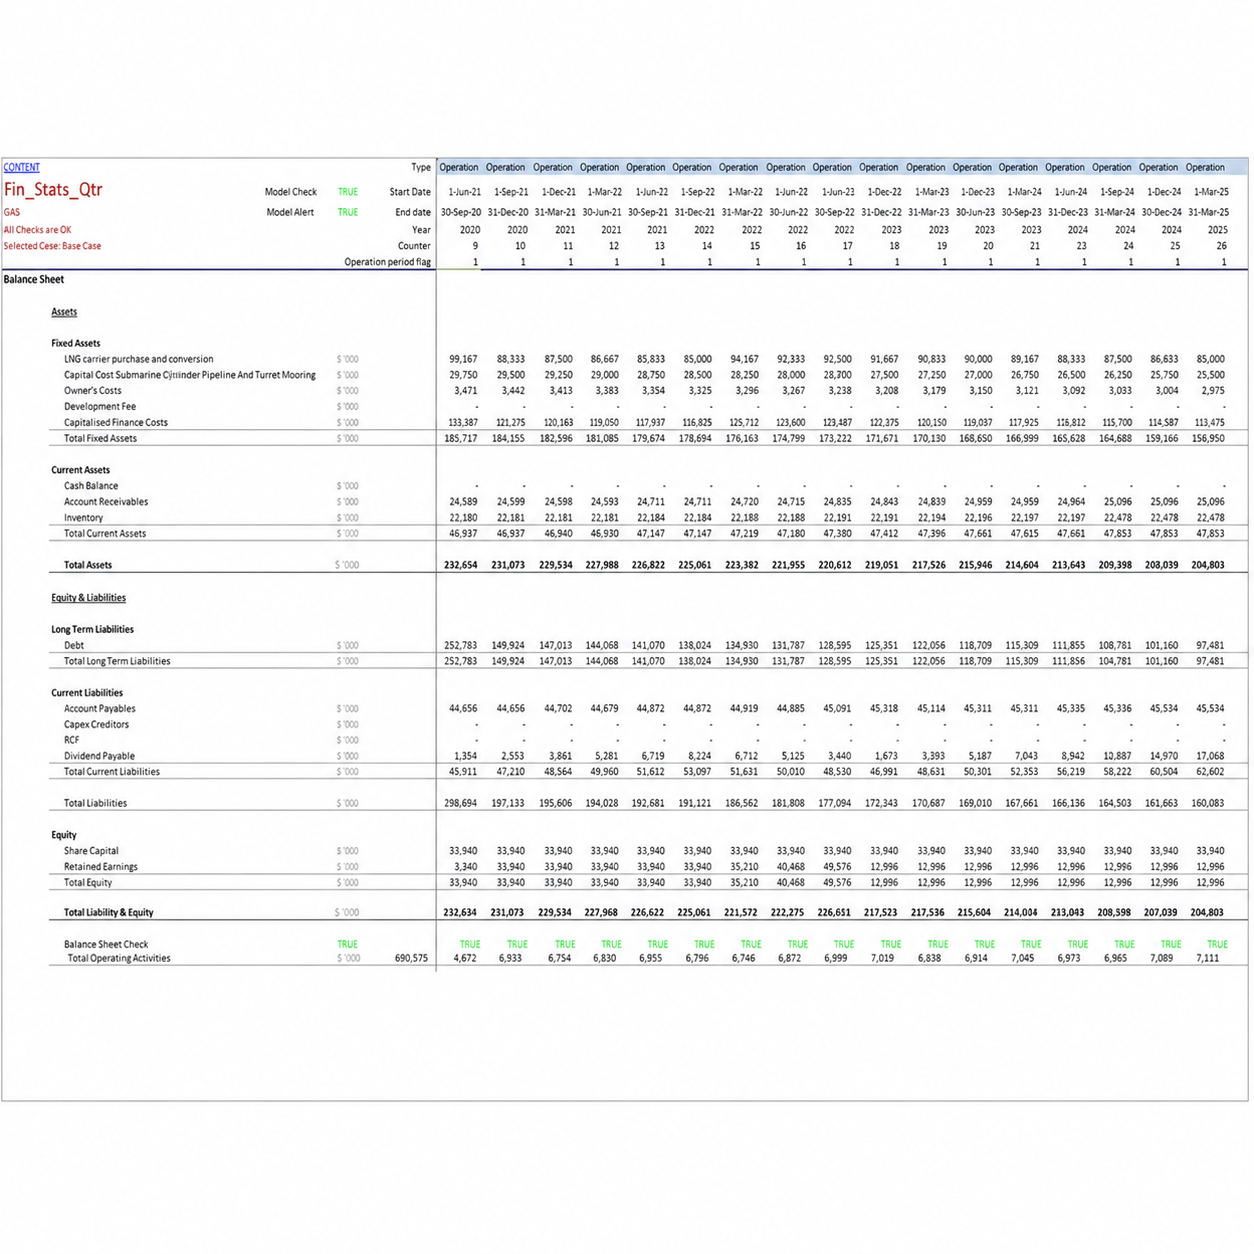
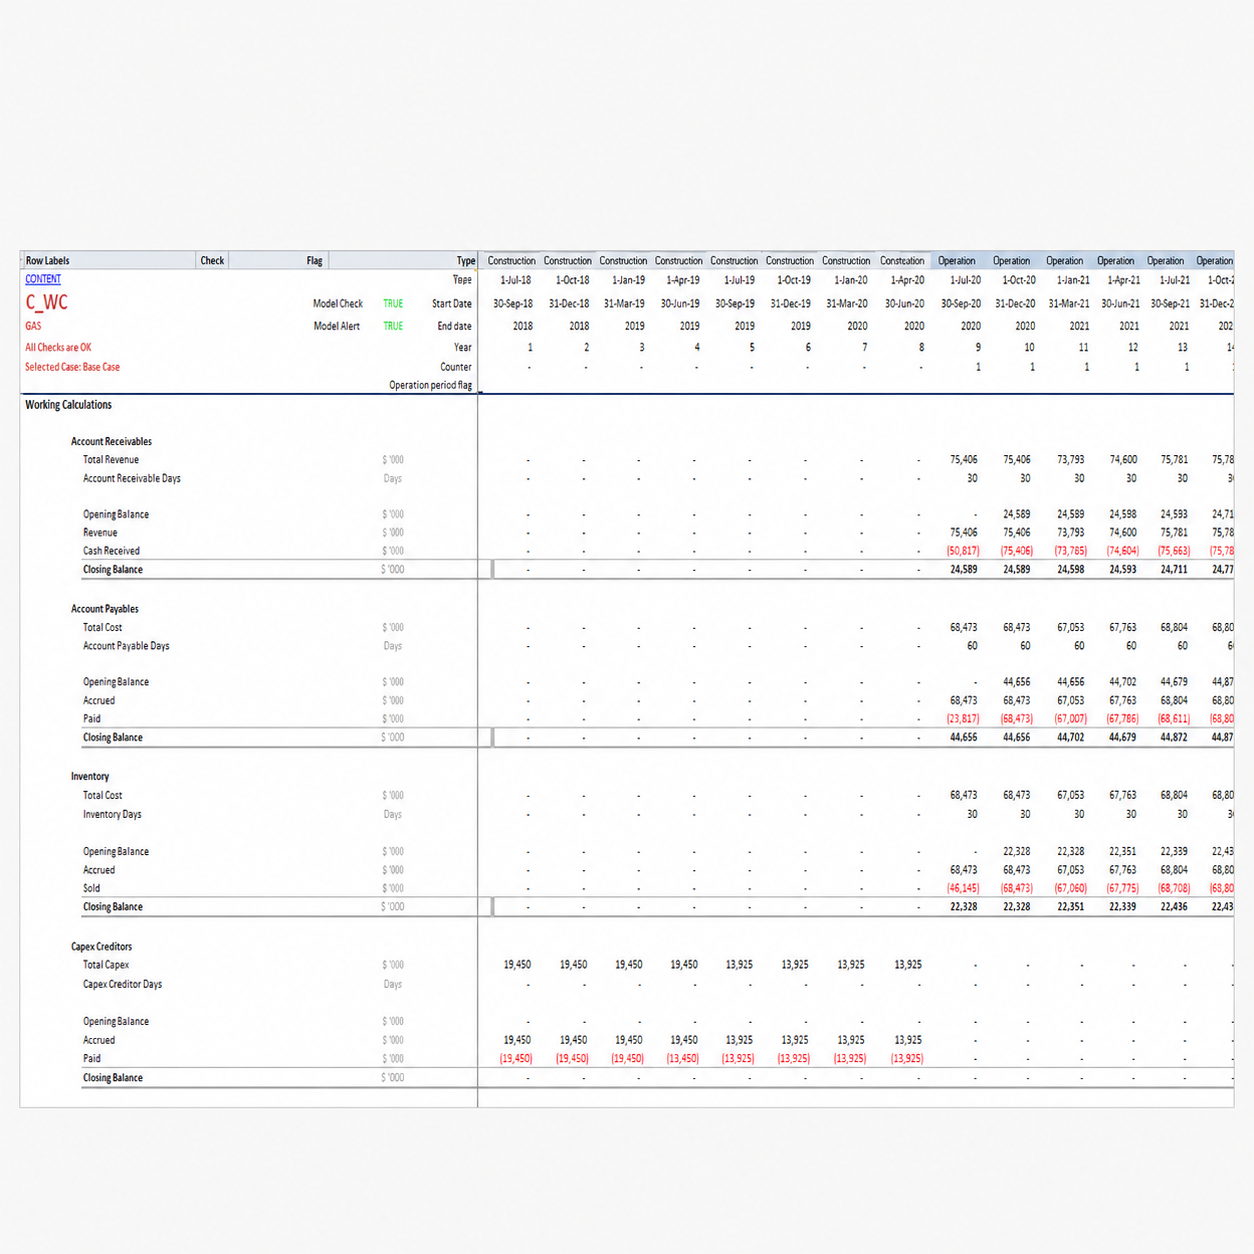
The outputs follow project finance convention: Project and Equity IRR and NPV, minimum and average DSCR, equity payback, a full cash waterfall and the debt service profile, alongside integrated financial statements and a dashboard.
Volume in this hydrogen sales financial model is split across an anchor power plant offtake and three third-party expansion tranches — and each carries its own tolling fee. That structure reflects how these businesses actually grow: an anchor customer underwrites the infrastructure at one price, and subsequent tranches are added at different, usually declining, rates as the network scales and competition arrives.
Modelling them separately lets you answer the questions that matter. How much anchor volume does the project need to be bankable? At what point does an expansion tranche stop adding value? What happens to returns if the third expansion never materialises? None of these can be asked of a model with a single blended tariff.
Every tolling fee carries its own indexation base and factor, plus a defined portion of the fee subject to escalation. That last input is the one most templates omit and most real contracts contain — in practice only part of a tariff escalates with inflation, and treating the whole fee as indexed will systematically overstate long-run revenue.
The same discipline runs through the cost side. Fixed opex, variable opex and gas price all carry independent indexation, so you can model a contract where costs escalate faster than revenue — the scenario that quietly erodes returns over a twenty-year concession.
Every driver of viability is an explicit, editable input. The assumptions cover:
| Gas Volumes | Volume sold to the power plant, plus three third-party expansion tranches, in kg |
| Tolling Fees | A separate fee per tranche in $/kg, each with its own escalation profile |
| Indexation | Base and factor per revenue line, with the portion of each fee subject to escalation |
| Gas Pricing | Delivered ex-ship (DES) gas price in $/kg, indexed |
| Bulk Breaking | Volume sold and price per tonne of hydrogen, with independent indexation |
| Fuel Costs | Auxiliary fuel consumption per day, hydrogen heat content, and fuel cost of gas sold |
| Operating Costs | Fixed opex including G&A, and variable opex per unit, each independently indexed |
| Levies | Levies as a percentage of sales |
| Funding Profile | Flexible debt and equity structuring across the funding stack |
The model distinguishes between revenue from the tolling fee and revenue from the sale of gas itself — two quite different businesses that often sit inside the same venture. Tolling is a service margin on volume you do not own; gas sales carry the commodity through your own balance sheet at the DES price. Bulk breaking adds a third line, priced per tonne. Keeping all three separate is what lets you see which part of the operation is actually generating the return.
This is where the hydrogen sales financial model earns its keep — resolving your assumptions into the metrics a funding decision turns on:
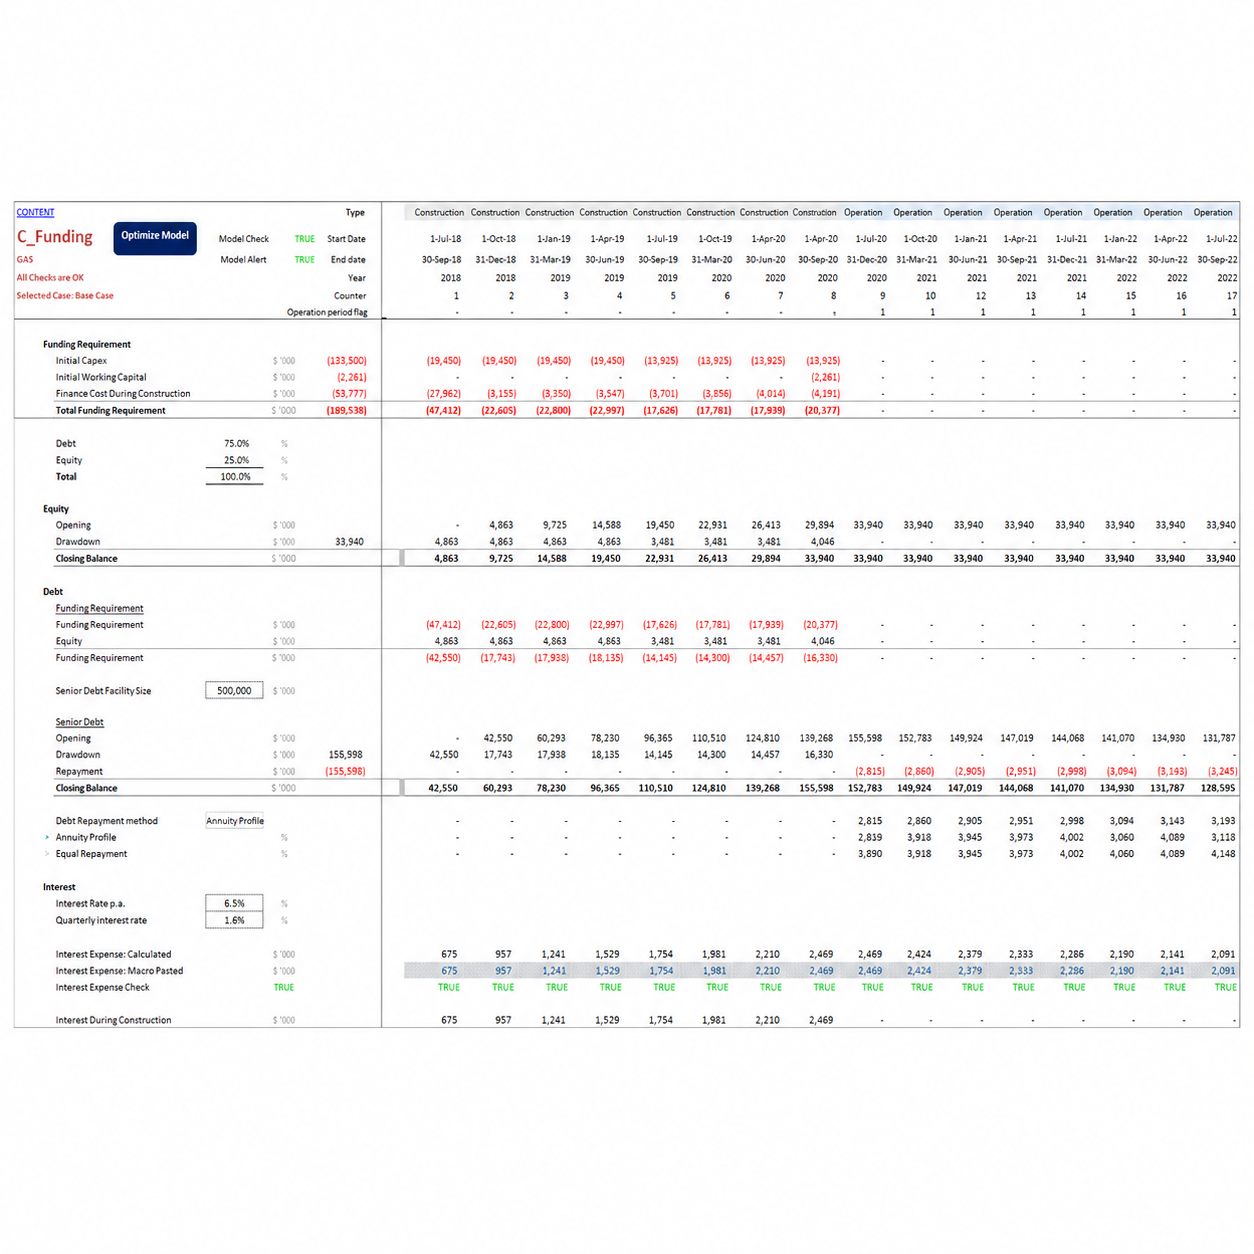
The model separates construction and operation cleanly, and lets you set the length and granularity of each — monthly, quarterly, semi-annual or annual — independently. Every revenue and cost assumption can be entered across three scenarios and switched at a button. The debt funding drawdown carries three scenarios of its own, valuable when negotiating terms with financial institutions, and repayment can be profiled as annuity, even-principal or sculpted.
Four offtake tranches with individual tolling fees, so you can model network expansion the way it actually happens.
The portion of each fee subject to indexation is an explicit input — the detail most templates omit and most contracts contain.
Service revenue and commodity revenue sit apart, so you can see which part of the business generates the return.
New to these metrics? Read an overview of the debt service coverage ratio. For a model built to your own specification, see our project finance advisory services, or browse the full range of PPP and project finance templates.
Four offtake tranches, indexed tolling fees, bulk breaking revenue, three scenarios and every metric from Project IRR to DSCR — ready in Excel.