$149.00
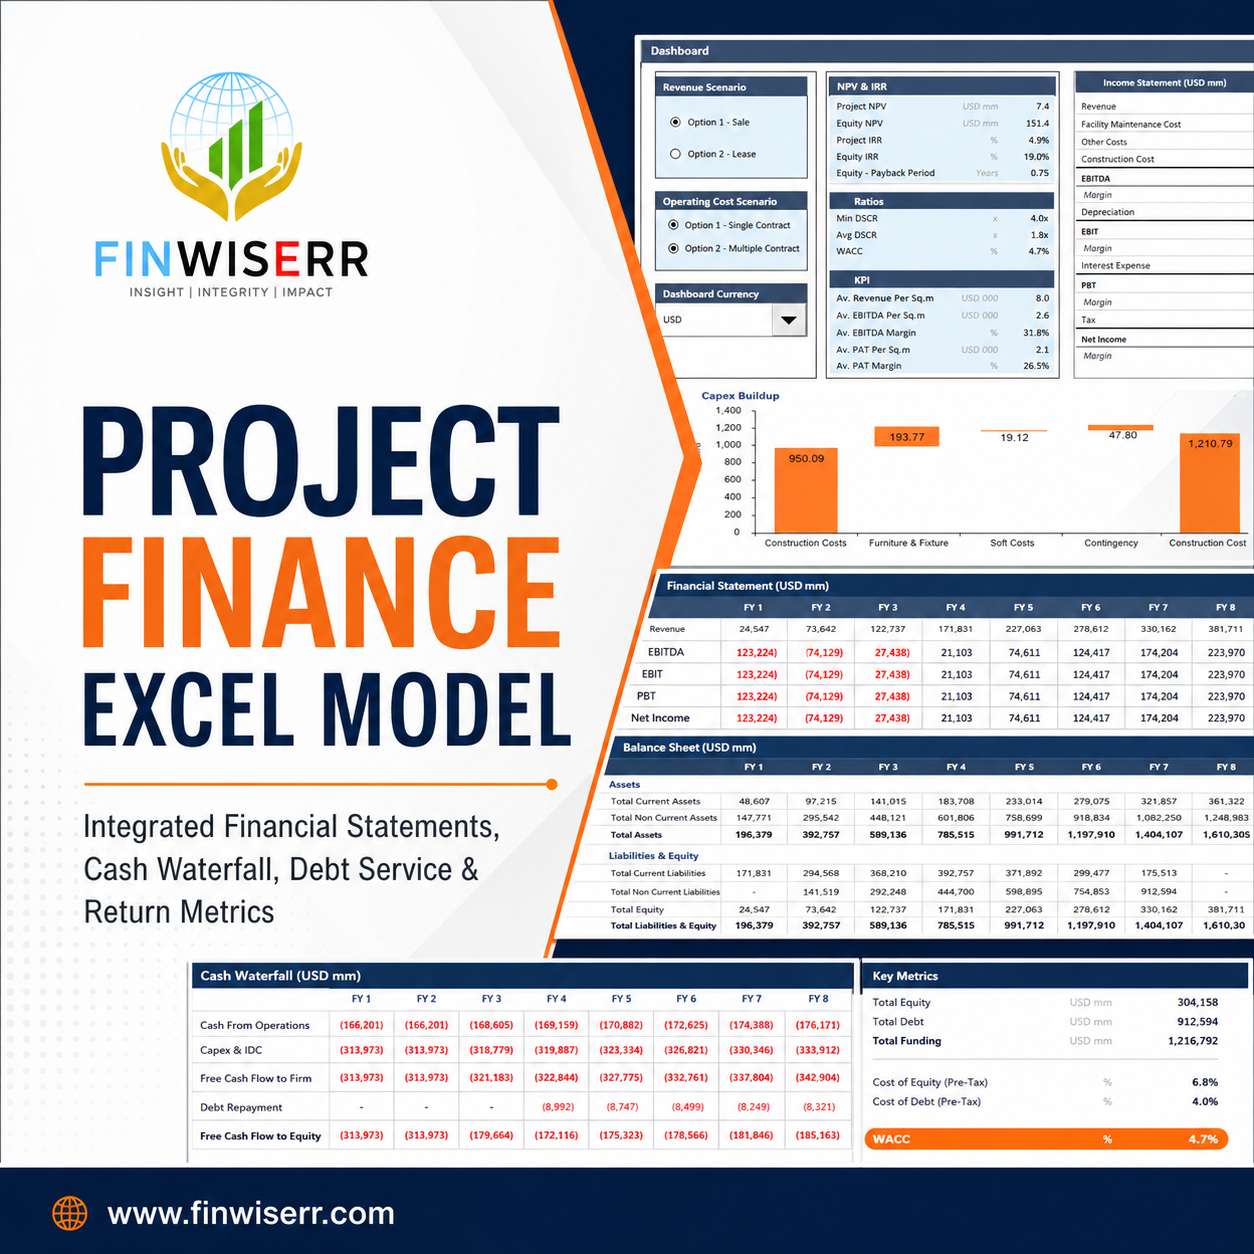
A detailed, institutional-grade real estate financial model for commercial property development — with a switchable lease-or-sell revenue structure, three integrated statements, valuation, a full cash waterfall and complete lender metrics, built in Excel.
Every commercial developer faces the same decision, and it is rarely obvious. Do you sell the completed asset and recycle the capital, or hold it and take rental income over years? Selling returns cash quickly and closes out the risk. Leasing produces a longer, steadier stream and a valuation that compounds — but it keeps you exposed to occupancy, tenant credit and the market cycle. The two paths produce entirely different cash flow profiles, different debt requirements and different returns.
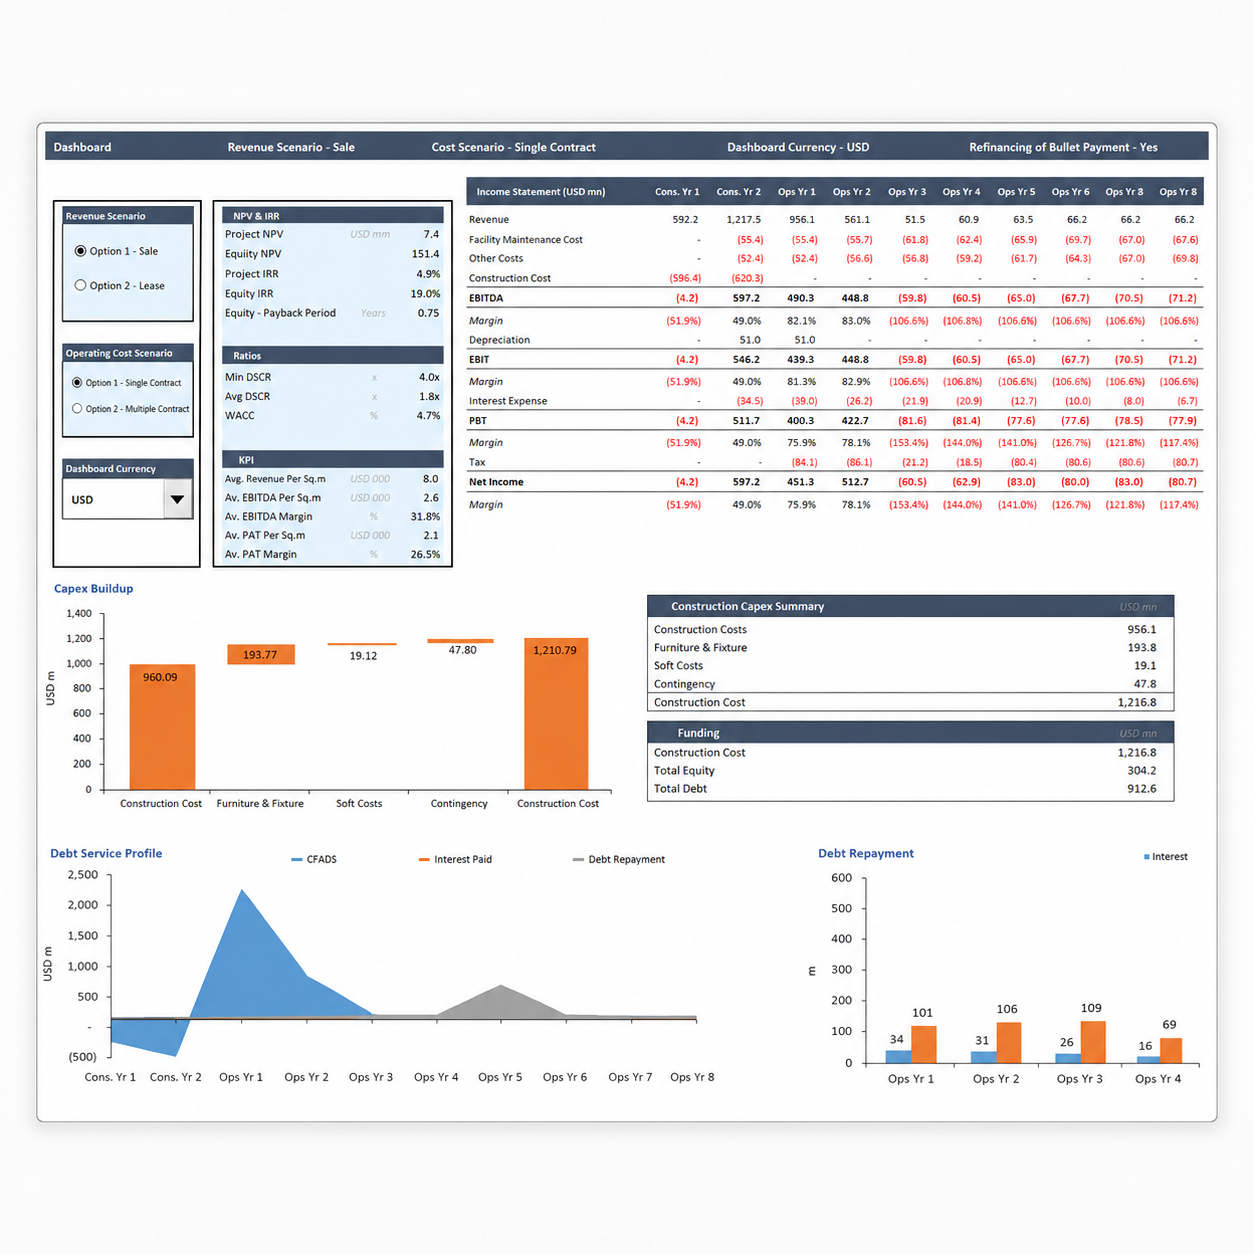
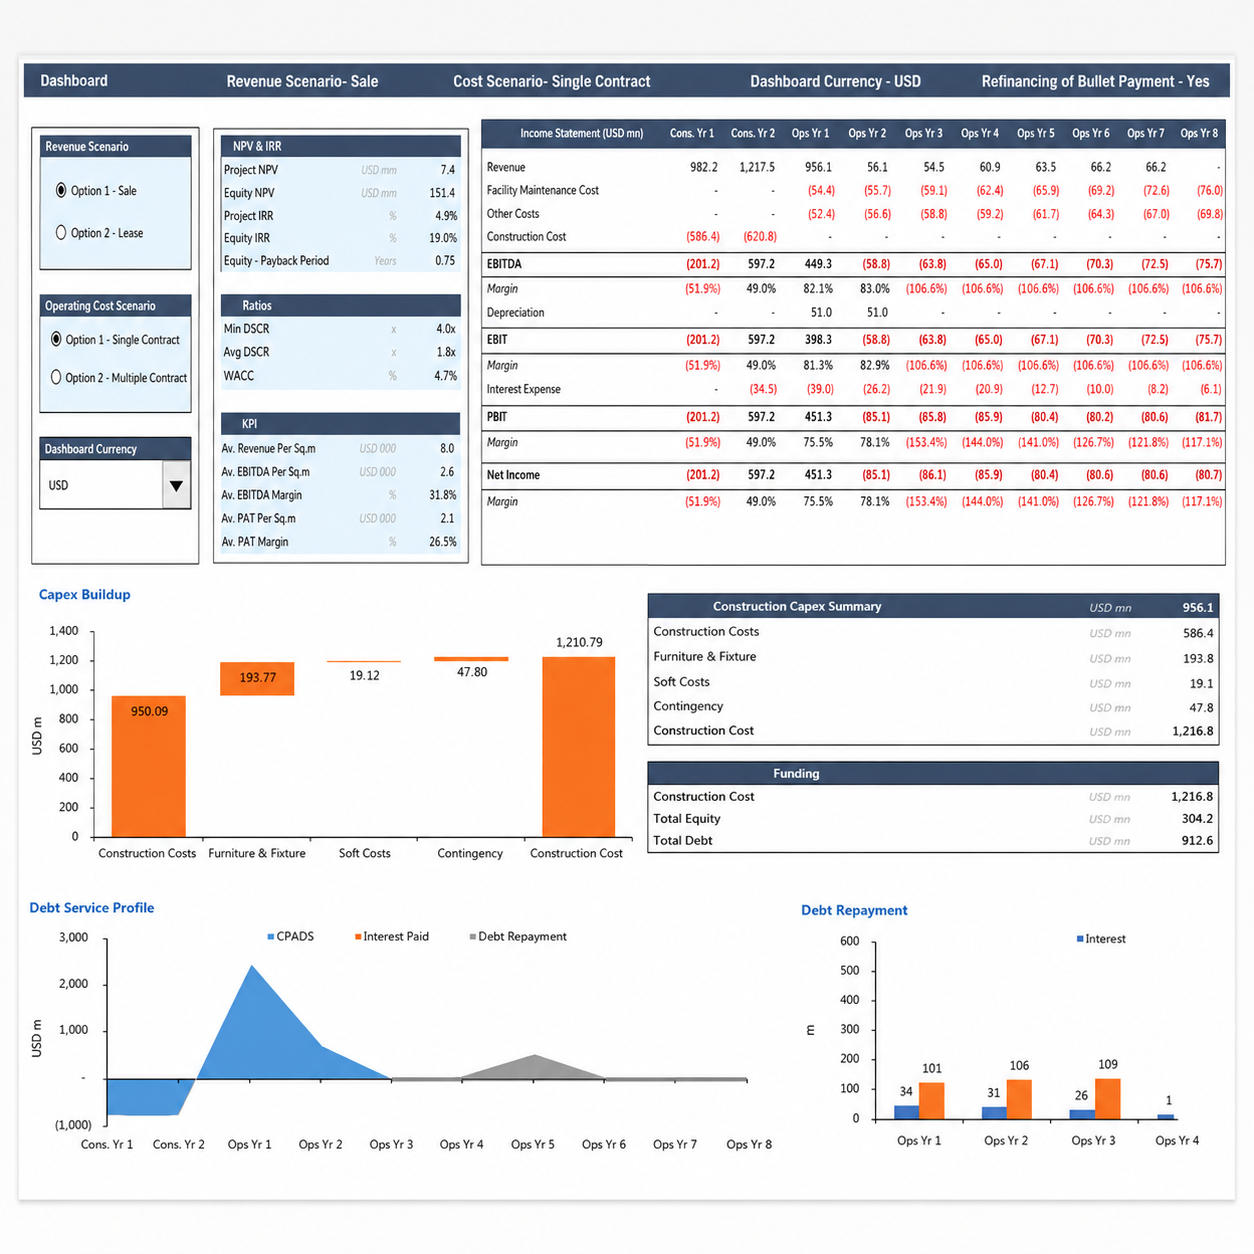
This real estate financial model answers that question directly. Gross developed area can be assumed leased or sold, and you switch between the two from the dashboard with a single click — watching the impact flow through the financial statements and every key performance indicator instantly. Rather than building two models and comparing them by hand, you compare strategies inside one file.
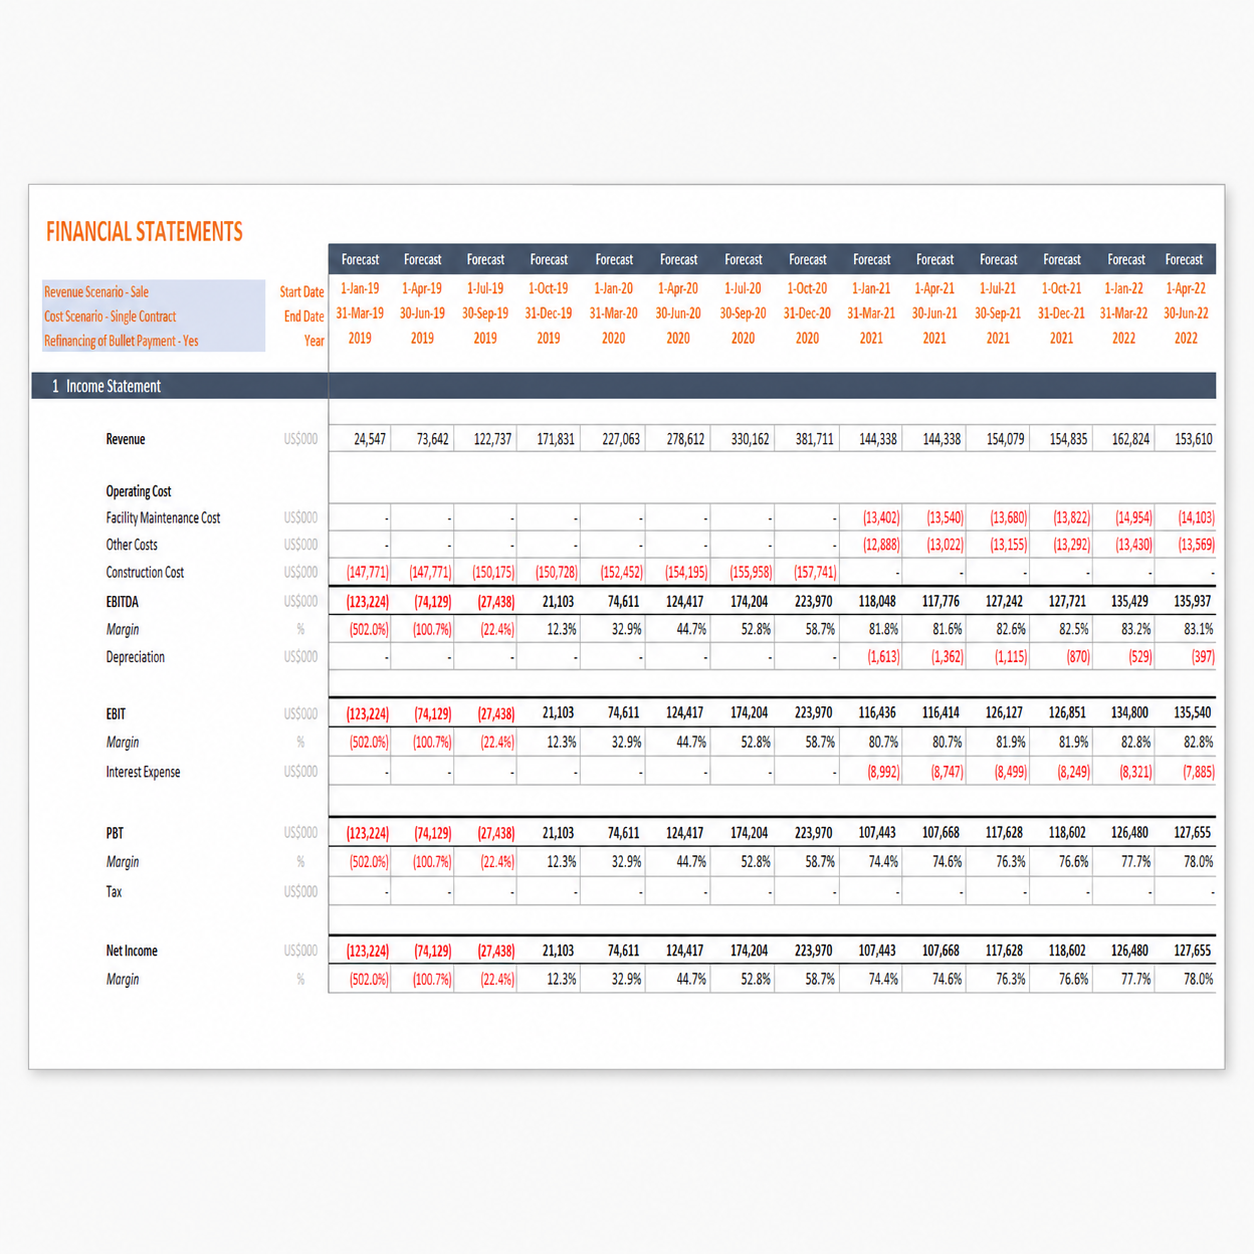
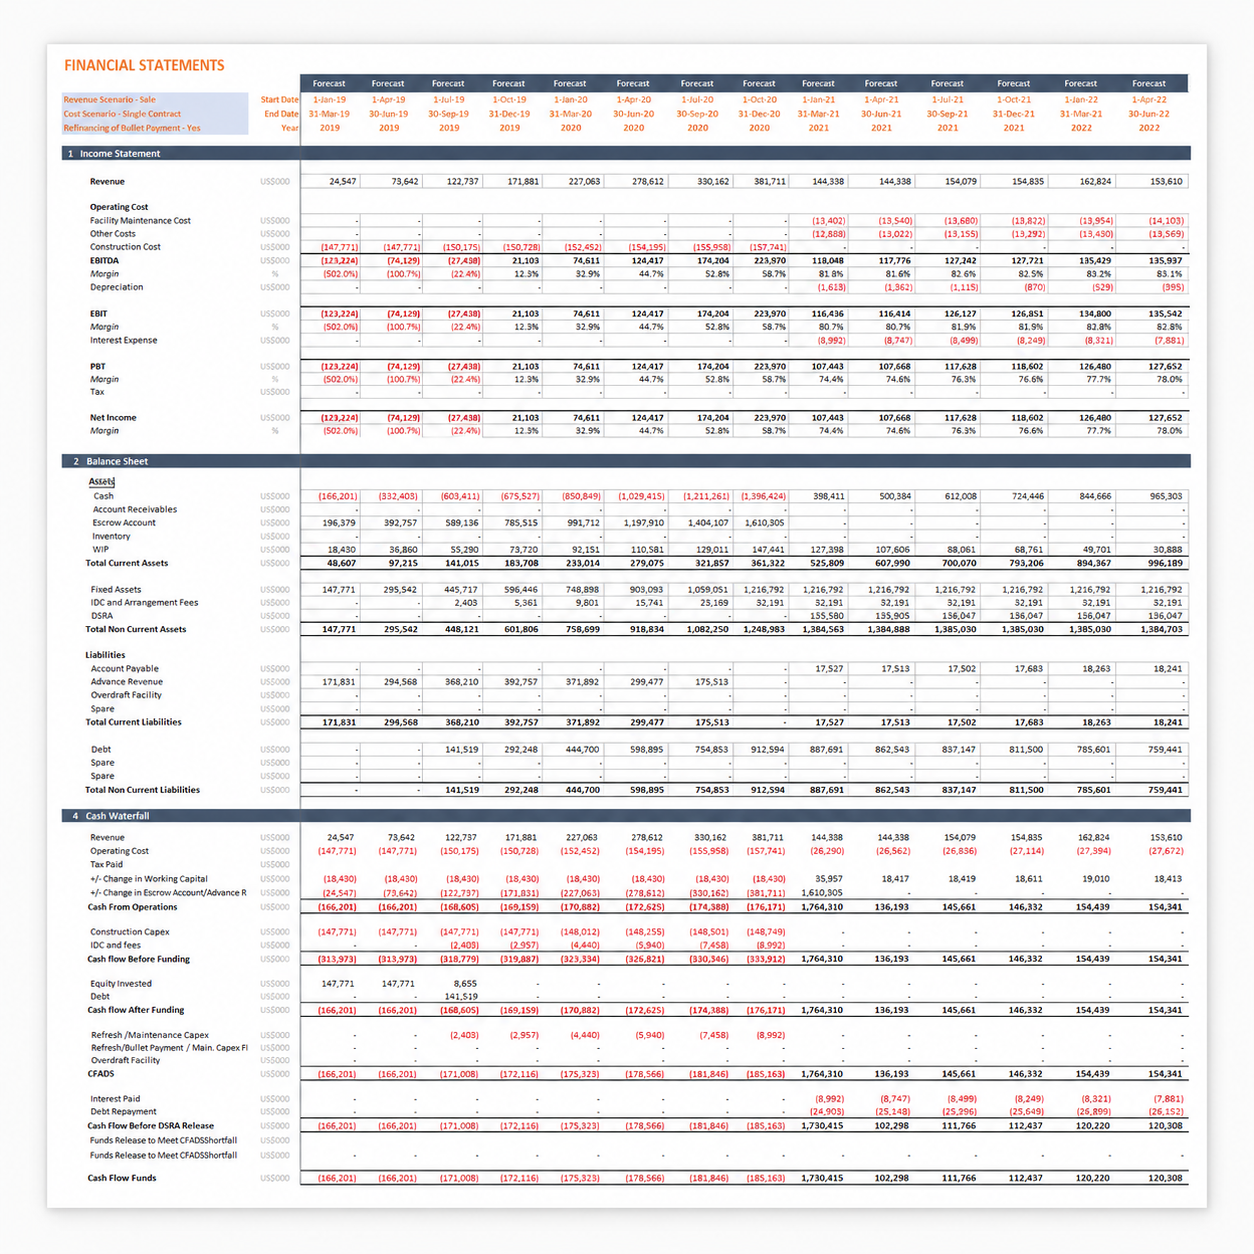
The outputs follow project finance convention: Project and Equity IRR and NPV, minimum and average DSCR, equity payback, a full cash waterfall and the debt service profile, alongside integrated financial statements and valuation.
This is the feature that makes the model worth having. Revenue is calculated on the assumption that gross developed area is either leased or sold, and the choice is a toggle rather than a rebuild. Change it and the financials, the KPIs and the valuation all update to reflect the alternative strategy.
For a developer preparing a board paper or an investment committee submission, that comparison is the analysis. Being able to present both scenarios side by side, from a single consistent set of construction and cost assumptions, is considerably more persuasive than two spreadsheets that may or may not agree with each other.
The cost side carries its own strategic choice. Maintenance across the gross developed area can be modelled as a single contractor engaged at a bucket rate, or as specialised service providers engaged separately to control cost. Both are common approaches in commercial property, and they produce meaningfully different operating expense profiles — particularly over an eight-year operating period where the difference compounds.
The real estate financial model is constructed around a live-scale proposal: a commercial development in the Middle East with a Gross Leasable Area of half a million square feet, running on a quarterly timeline across two years of construction and eight years of operation.
That grounding matters. A model built to a real project scale handles the things that only appear at scale — phased construction drawdown, interest capitalised through the build, lease-up over multiple quarters — rather than breaking the moment you enter realistic numbers. The quarterly timeline gives you the granularity to see all of it.
Beyond producing numbers for a specific development, this is a working demonstration of how property project finance is assembled. Work through it and you will see flexible capital structuring in practice, construction standby facilities, DSRA reserve provisions, lender covenants, a complex cash waterfall, and how DSCR and both IRRs are built from the underlying cash flows. For anyone refreshing their project finance modelling, that is worth as much as the output itself.
Lease and sell scenarios toggle from the dashboard, so you compare exit strategies on identical assumptions.
Construction drawdown, capitalised interest and lease-up are visible quarter by quarter rather than averaged away.
Clearly defined input, calculation and output cells, so you can audit the logic or adapt it to your own scheme.
New to these metrics? Read an overview of the debt service coverage ratio. For a model built to your own specification, see our project finance advisory services, or browse the full range of PPP and project finance templates.
A quarterly development model with a lease-or-sell toggle, integrated statements, valuation and every lender metric from Project IRR to DSCR — ready in Excel.