$149.00
A detailed, institutional-grade solar rooftop financial model for assessing the feasibility of a rooftop PV project, capturing every essential input across construction, operation and financing — with LCOE, exit analysis, a full cash waterfall and complete lender metrics, built in Excel.
Rooftop solar looks simpler than utility-scale, and in engineering terms it often is. Financially it is not. You are building on someone else’s roof, which means rental payments, a lease term that may not match your PPA, and an asset whose economics depend on a structure you do not own. Add degradation, seasonality and an irradiation profile specific to that one location, and the case for a rooftop project rests on a narrower set of assumptions than a solar farm ever does.
This solar rooftop financial model was built for exactly that assessment. It helps you evaluate the financial viability of a rooftop PV project by capturing the full input set — plant capacity and yield, irradiation and degradation factors, PPA and tariff structure, roof rental and the operating cost base — and resolving them into the metrics a developer, sponsor or lender needs to reach a decision.
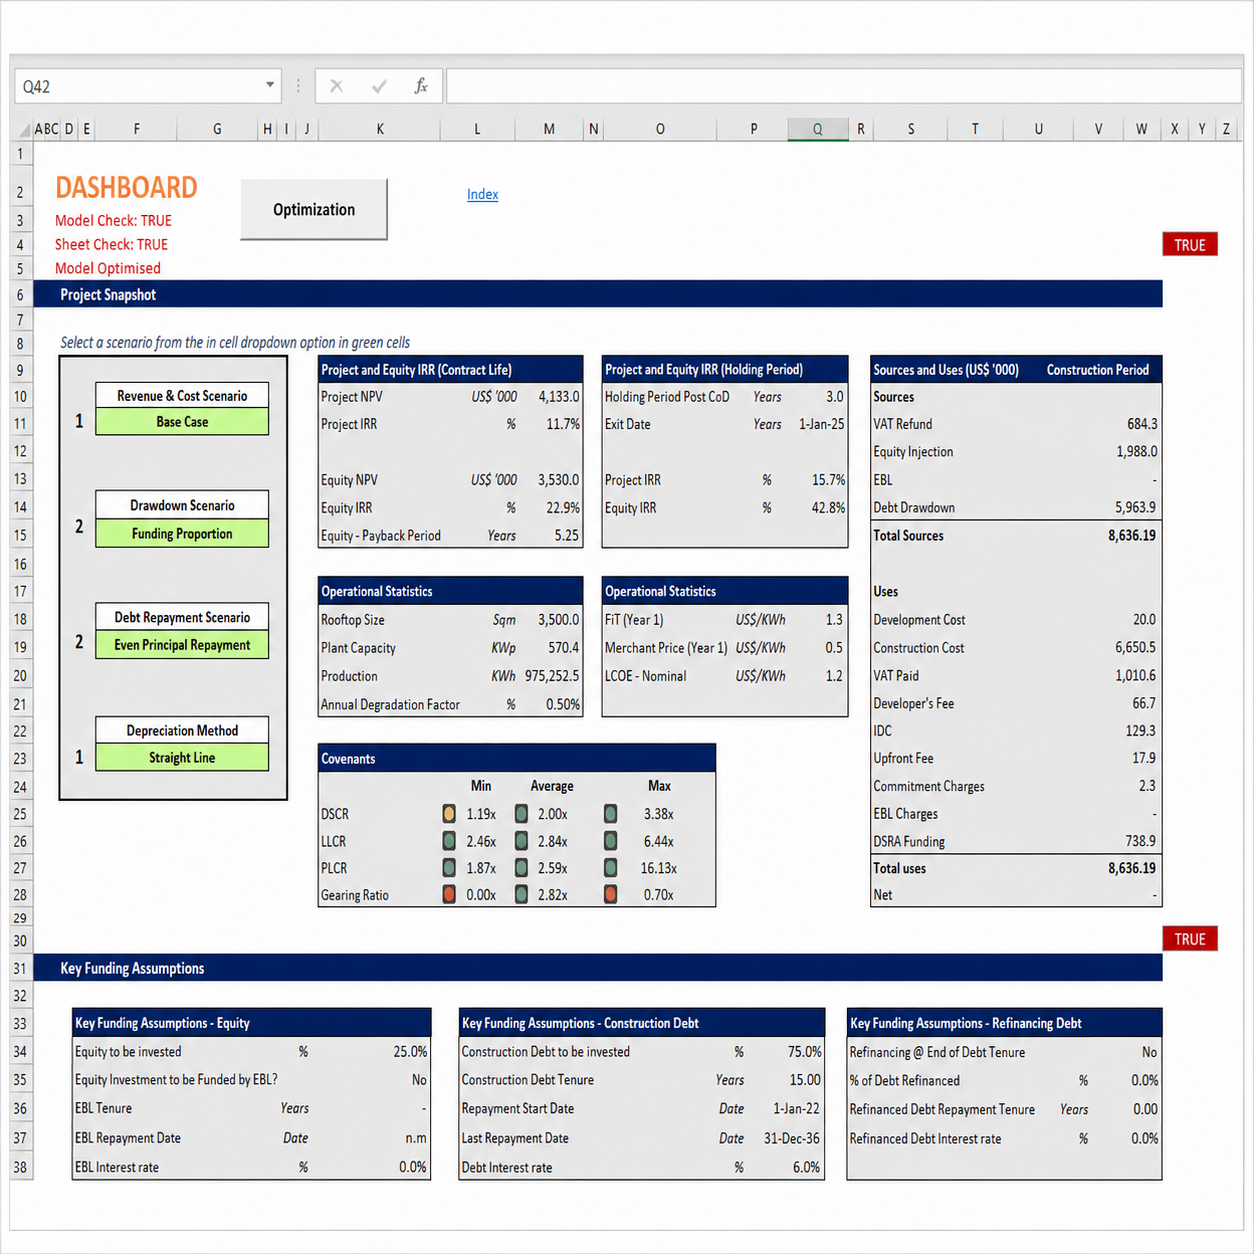
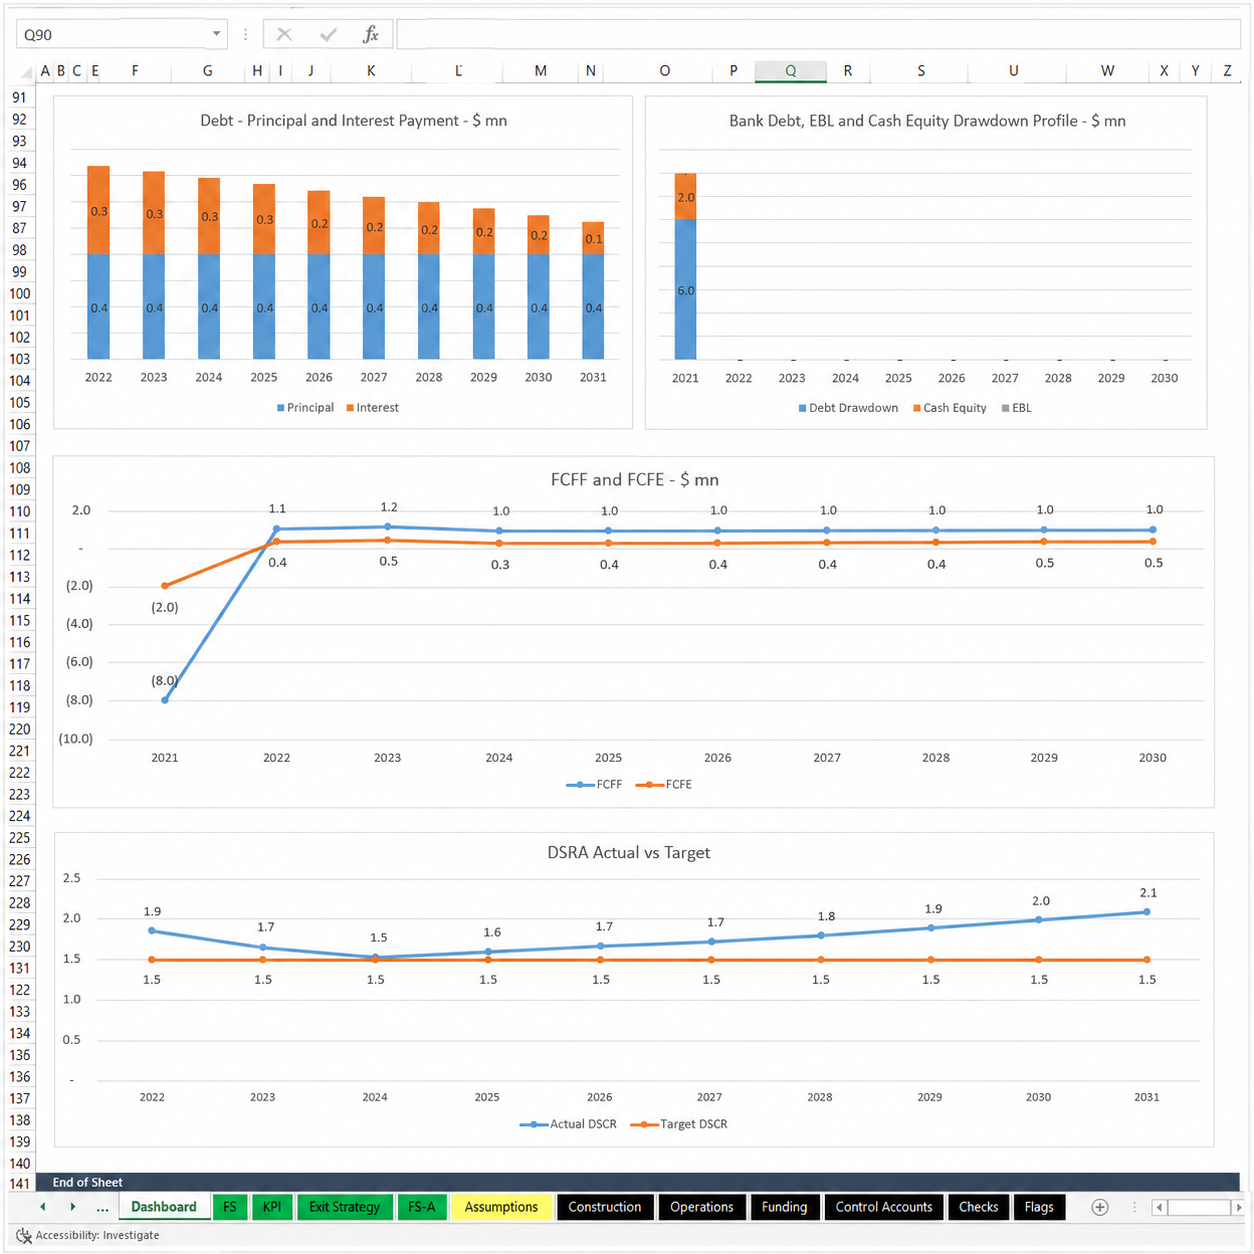
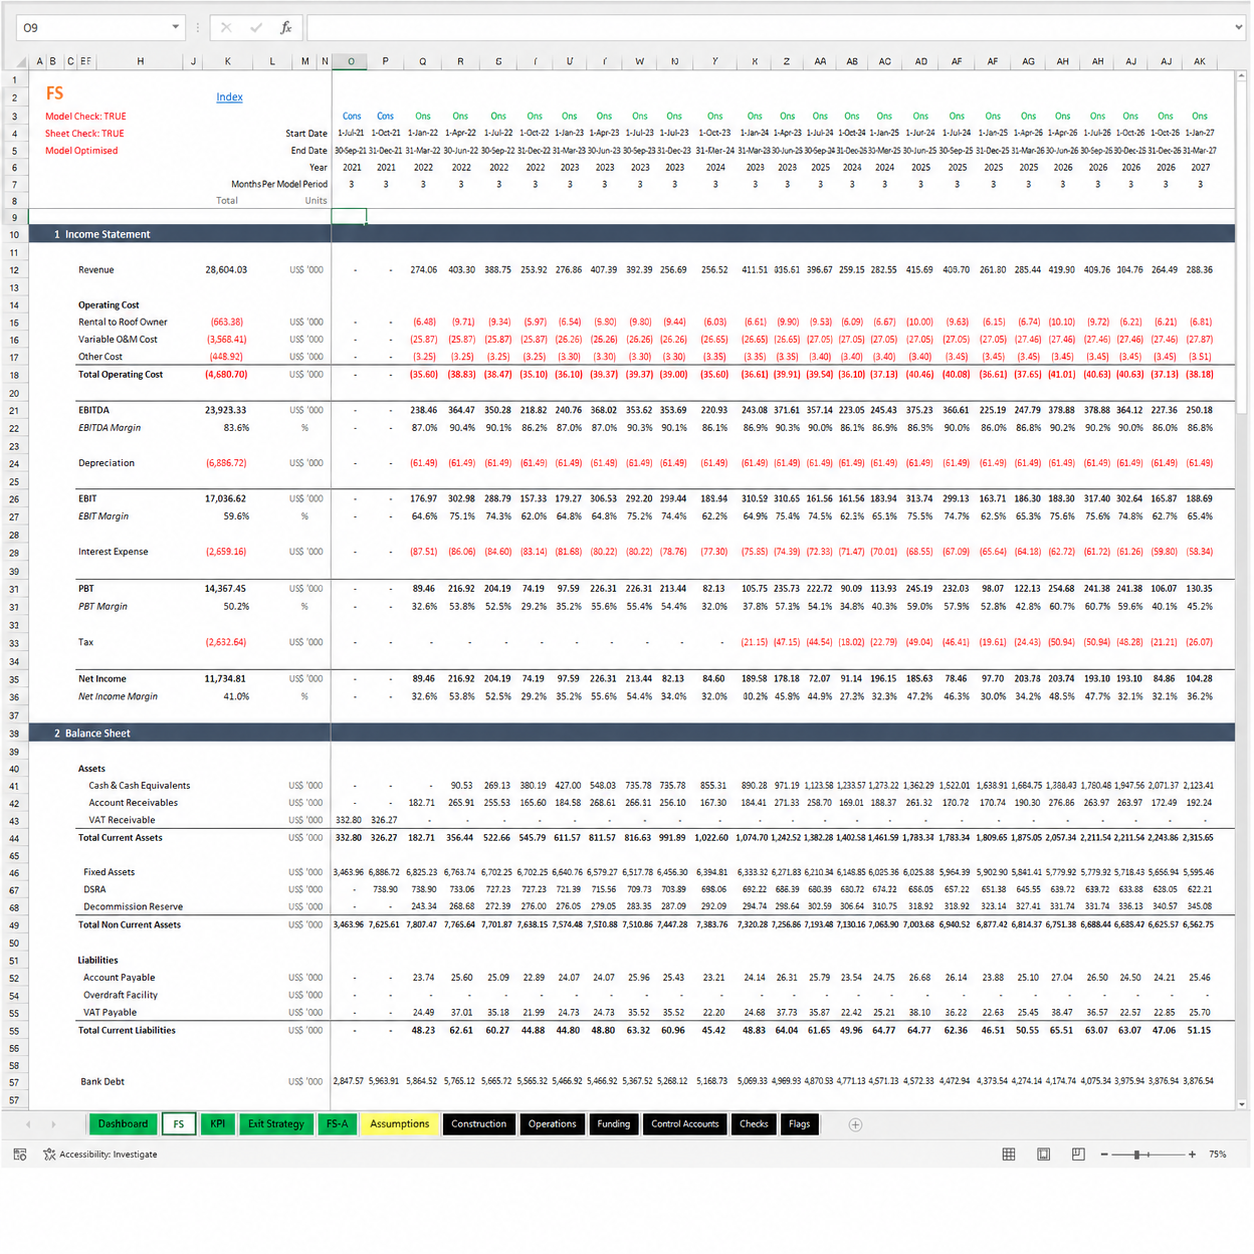
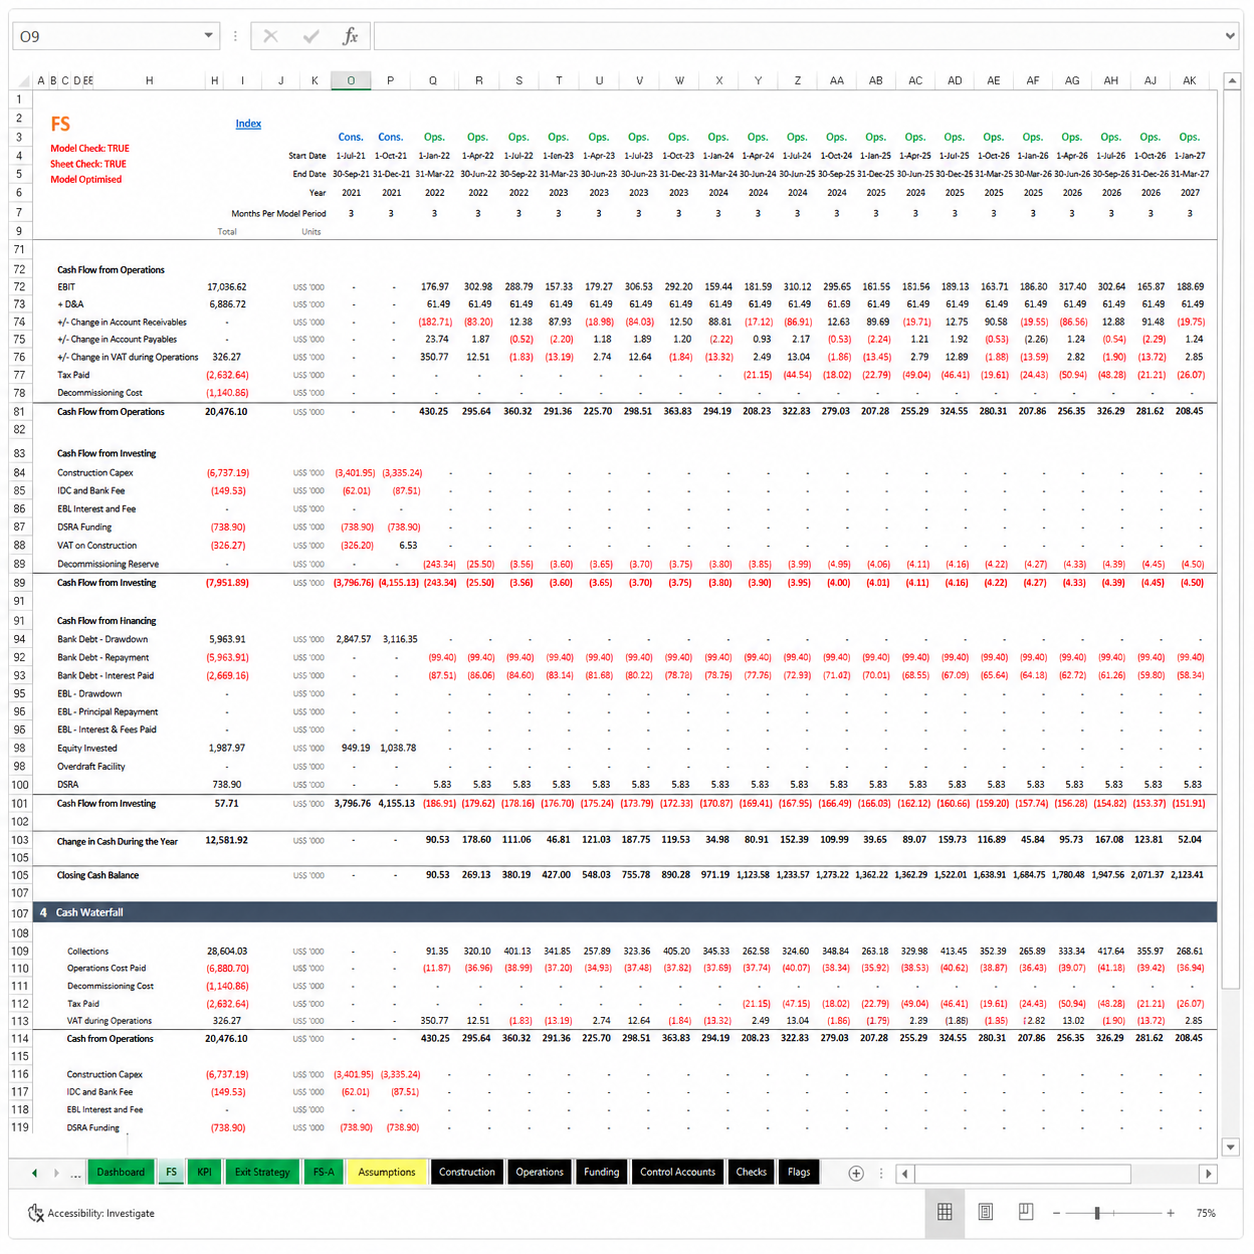
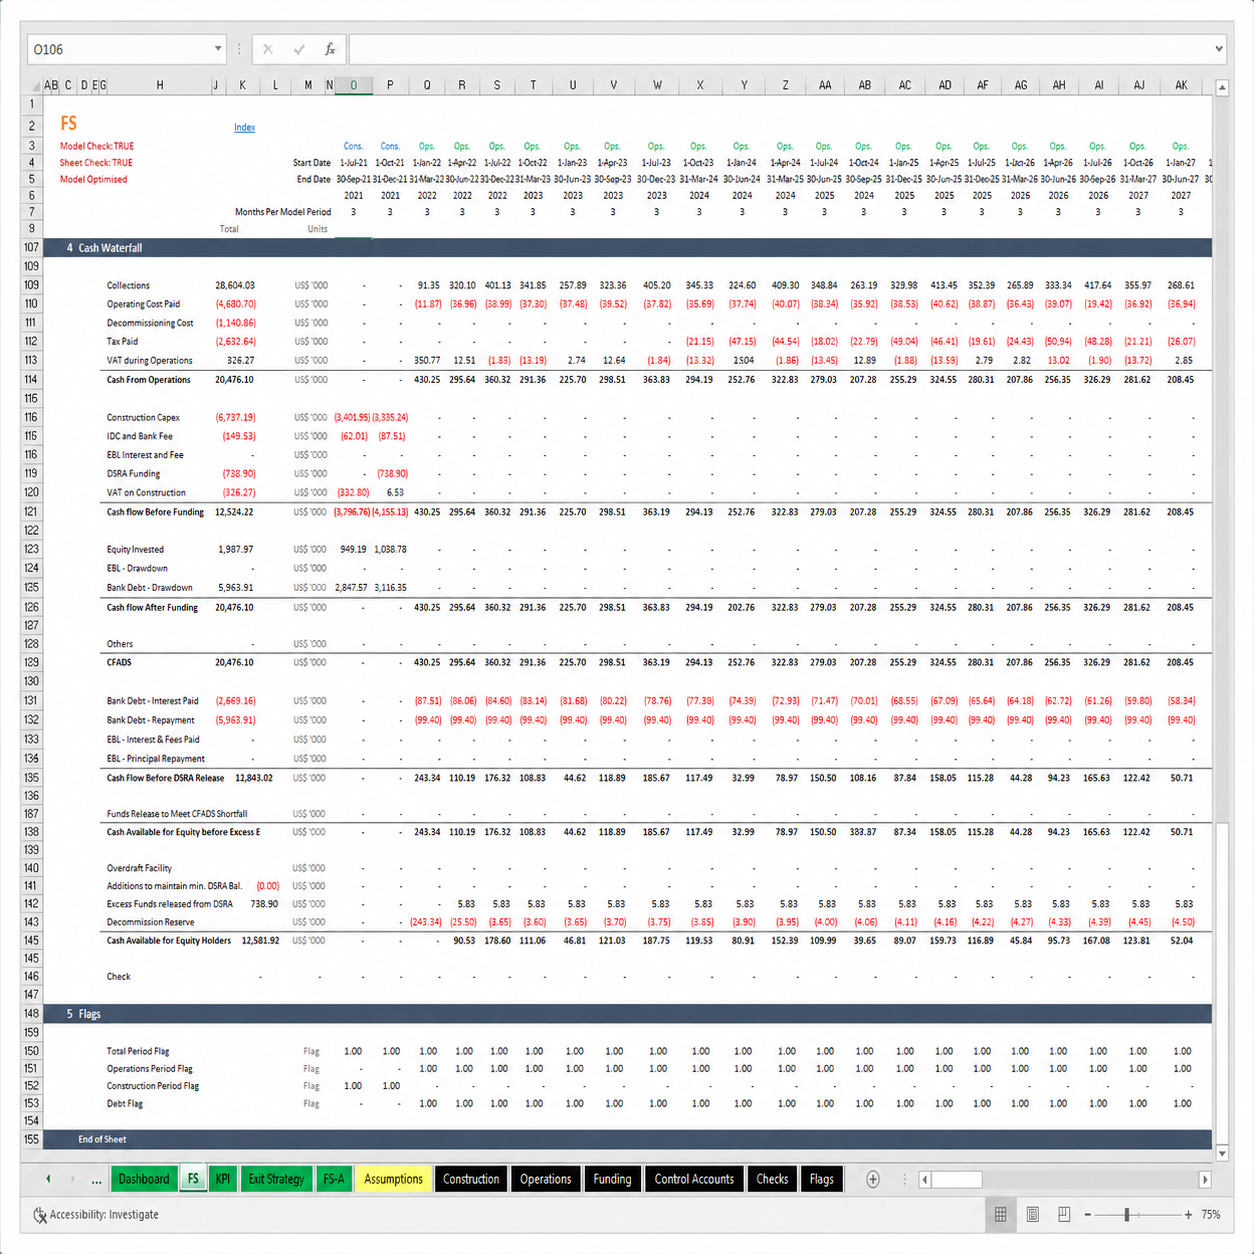
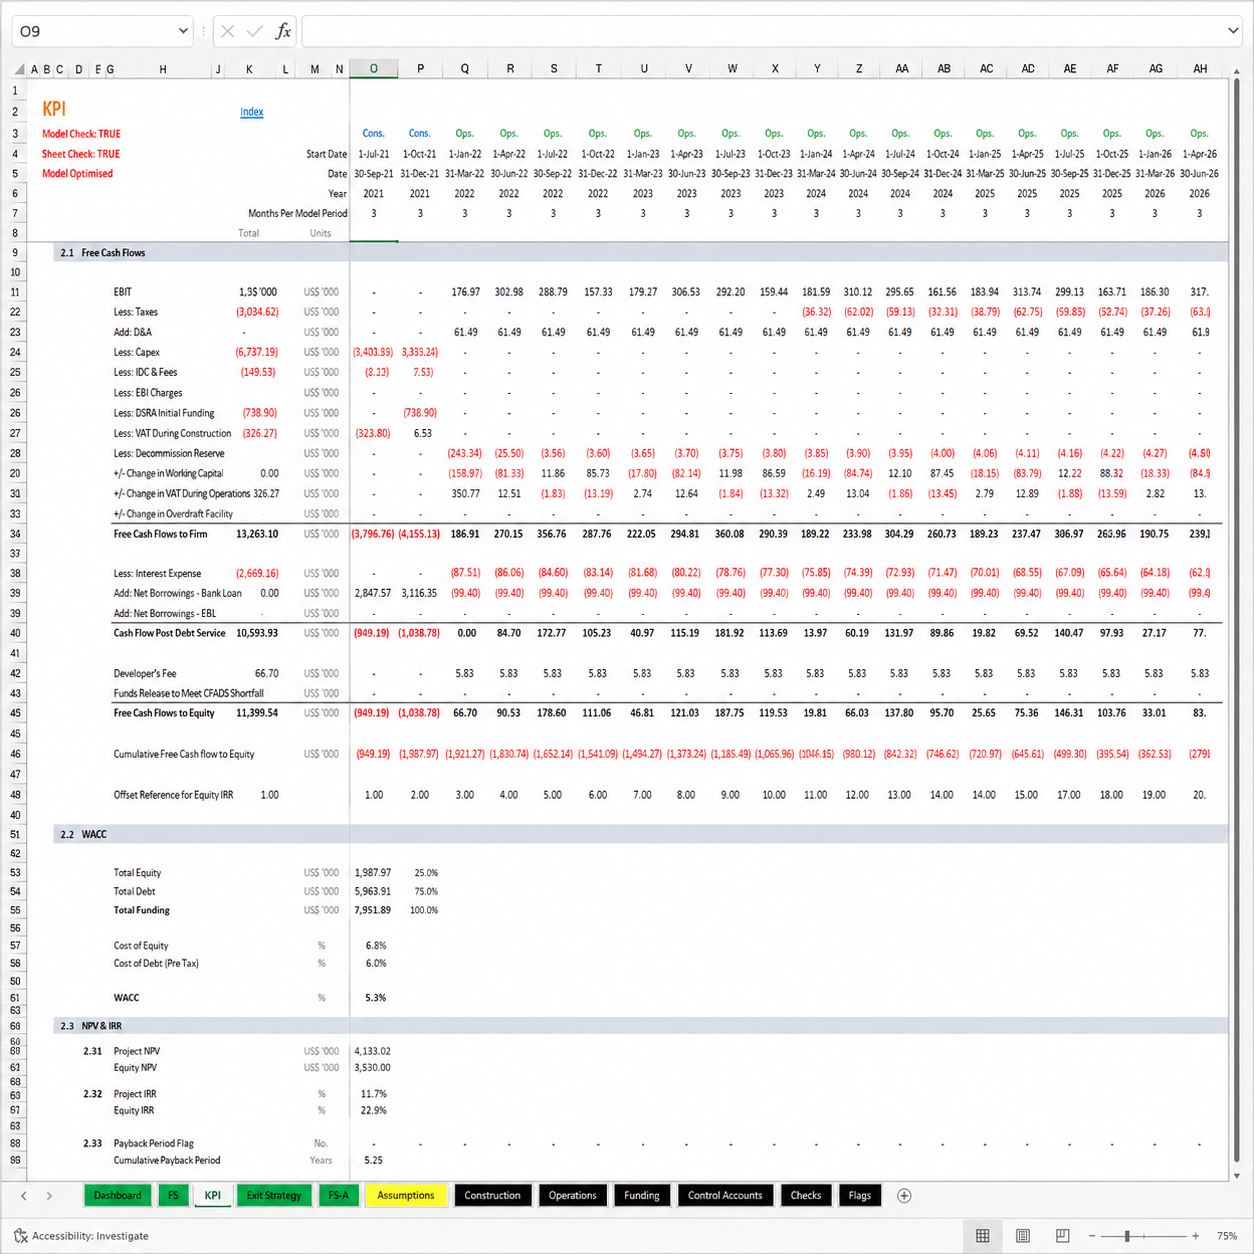
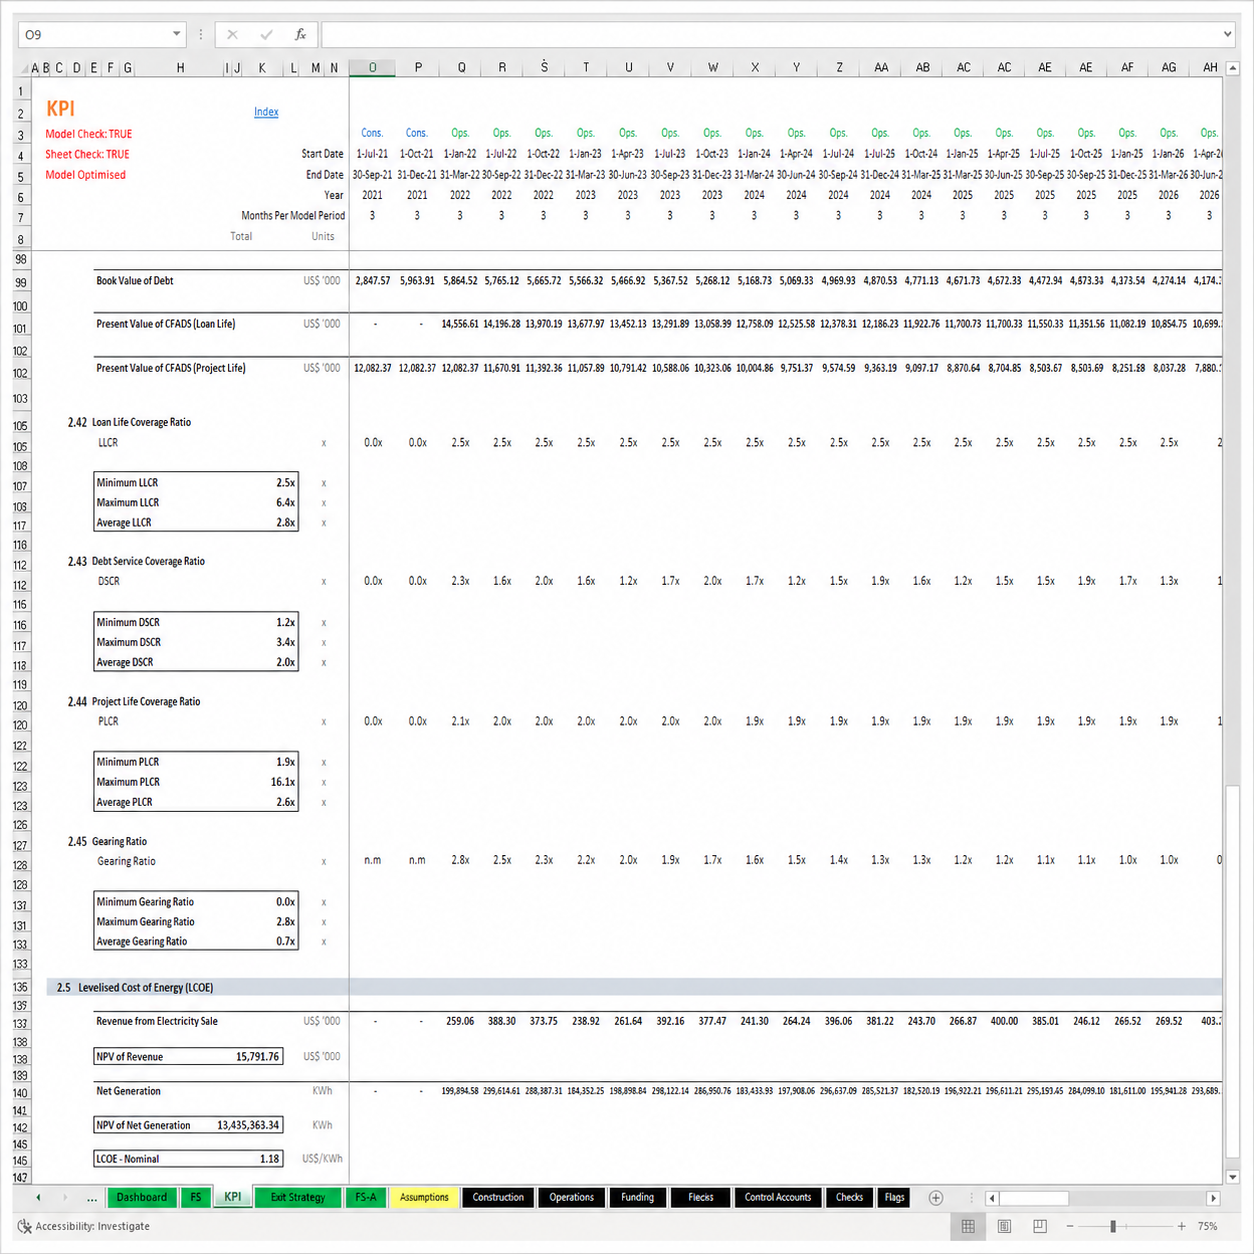
The outputs go beyond the standard suite. Alongside Project and Equity IRR and NPV, minimum and average DSCR, LLCR, PLCR, equity payback and a full cash waterfall, the model produces the Levelised Cost of Energy (LCOE) and a dedicated exit analysis.
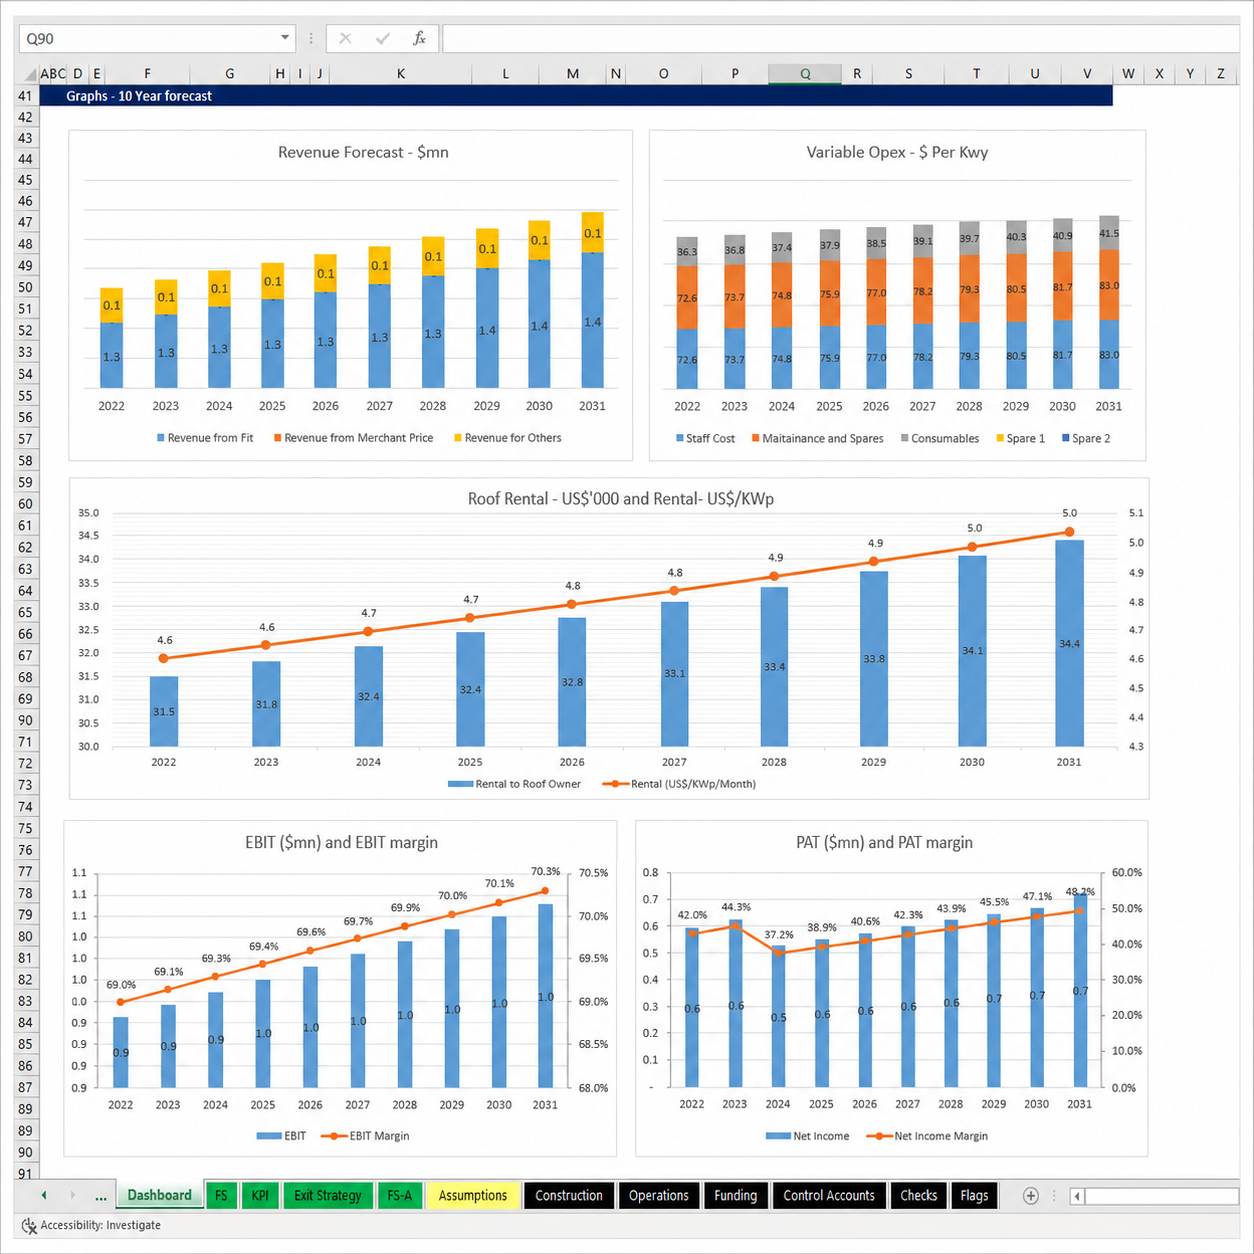
The single feature that separates a rooftop project from a ground-mounted one is that you pay for the space. Roof rental sits as an explicit input in this solar rooftop financial model rather than being absorbed into general operating cost — which lets you answer the question every rooftop developer eventually faces: at what rental does this project stop working?
That number is the basis of every negotiation with a building owner. Knowing it precisely, before you sit down, is worth considerably more than a general sense that the rent seems high.
Output is built from plant capacity, capacity factor and annual yield, adjusted by an irradiation factor, a degradation factor and production seasonality. Each of those matters, and templates that omit them systematically overstate returns.
Degradation is the one most often skipped. A panel producing a fraction less each year sounds trivial until you compound it across a twenty-five year asset life — at which point it moves LCOE, DSCR in the later years, and the value of any exit. Modelling it explicitly is what separates a forecast a lender will accept from one they will not.
Every driver of viability is an explicit, editable input. The assumptions cover:
| Development & Construction | Development cost, construction cost and developer’s fee |
| Generation Profile | Plant capacity, capacity factor, annual yield, irradiation factor, degradation factor and production seasonality |
| Revenue | PPA term, feed-in tariff (FiT), merchant price and other revenue sources |
| Roof Rental | Rental cost payable to the building owner |
| Variable O&M | Five subheads — staff, electricity, consumables, transport and fuel, and other |
| Fixed Costs | SPV cost, insurance, land lease, community payment, management fee and more |
| Funding Profile | Cash equity, bridge loan, bank debt, DSRA and bank overdraft |
| Adjustments | Depreciation options, inflation and indexation, VAT, working capital and decommissioning reserve |
The Levelised Cost of Energy spreads total lifetime cost across total lifetime generation to give a single cost per unit — the figure against which any tariff, PPA price or grid alternative is judged. For rooftop projects competing against a retail electricity tariff, it is the number that tells you whether the proposition stands up at all.
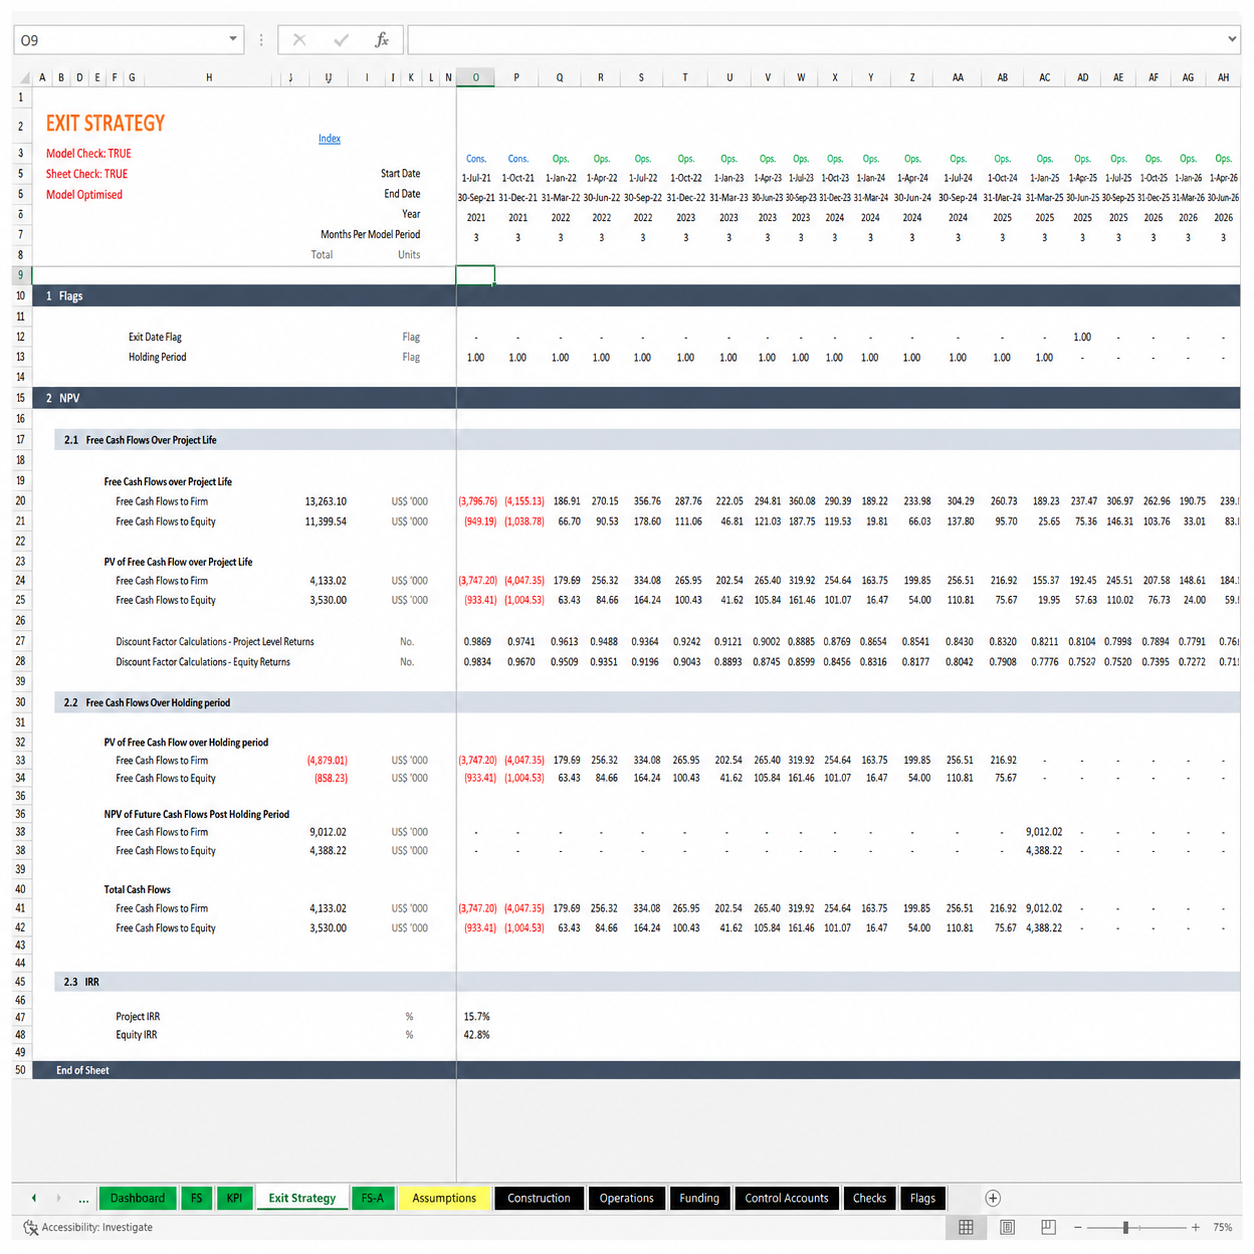
The exit analysis addresses a different question, and one most templates ignore entirely. Rooftop portfolios are routinely built to be sold, and the terminal value at exit often represents a substantial share of total equity return. Modelling it explicitly lets you present a complete investment case rather than one that simply stops at the end of the forecast.
The model runs on a quarterly timeline across two distinct phases, construction and operations. Quarterly granularity gives you finer detail than an annual view where it matters most — capitalising interest through construction, modelling a production ramp, and capturing seasonal output swings that an annual average would flatten out entirely. Every revenue and cost assumption can be entered across three scenarios and switched at a button, with three debt drawdown scenarios and a choice of annuity or even-principal repayment.
Rental cost is an explicit input, so you know exactly what you can afford to pay before you negotiate.
Terminal value is modelled, so the investment case covers the sale as well as the operating years.
Seasonal output and construction interest are captured properly rather than averaged into invisibility.
New to these metrics? Read an overview of the debt service coverage ratio. For a model built to your own specification, see our project finance advisory services, or browse the full range of PPP and project finance templates.
Roof rental, degradation and seasonality, LCOE, exit analysis and every lender metric from Project IRR to PLCR — on a quarterly timeline, ready in Excel.