$149.00
A detailed, user-friendly oil and gas downstream financial model with three integrated financial statements and a full DCF-based valuation, built entirely in Excel.
Downstream oil and gas is a throughput business. Refining and processing assets are enormously capital-intensive, margins are thin relative to turnover, and the economics turn on capacity utilisation far more than on headline sales growth. A refinery running at 92 percent of nameplate is a different business from the same refinery running at 78 percent — and no revenue growth rate assumption will capture that distinction.
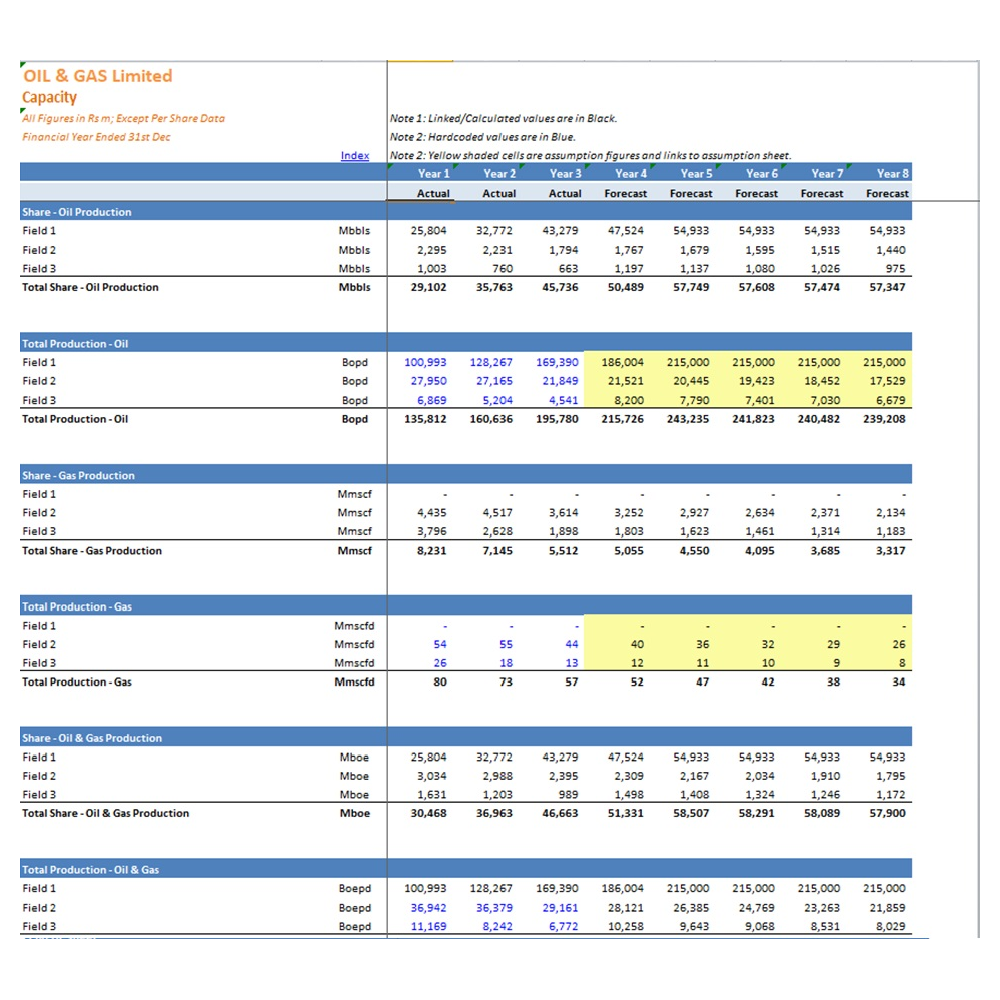
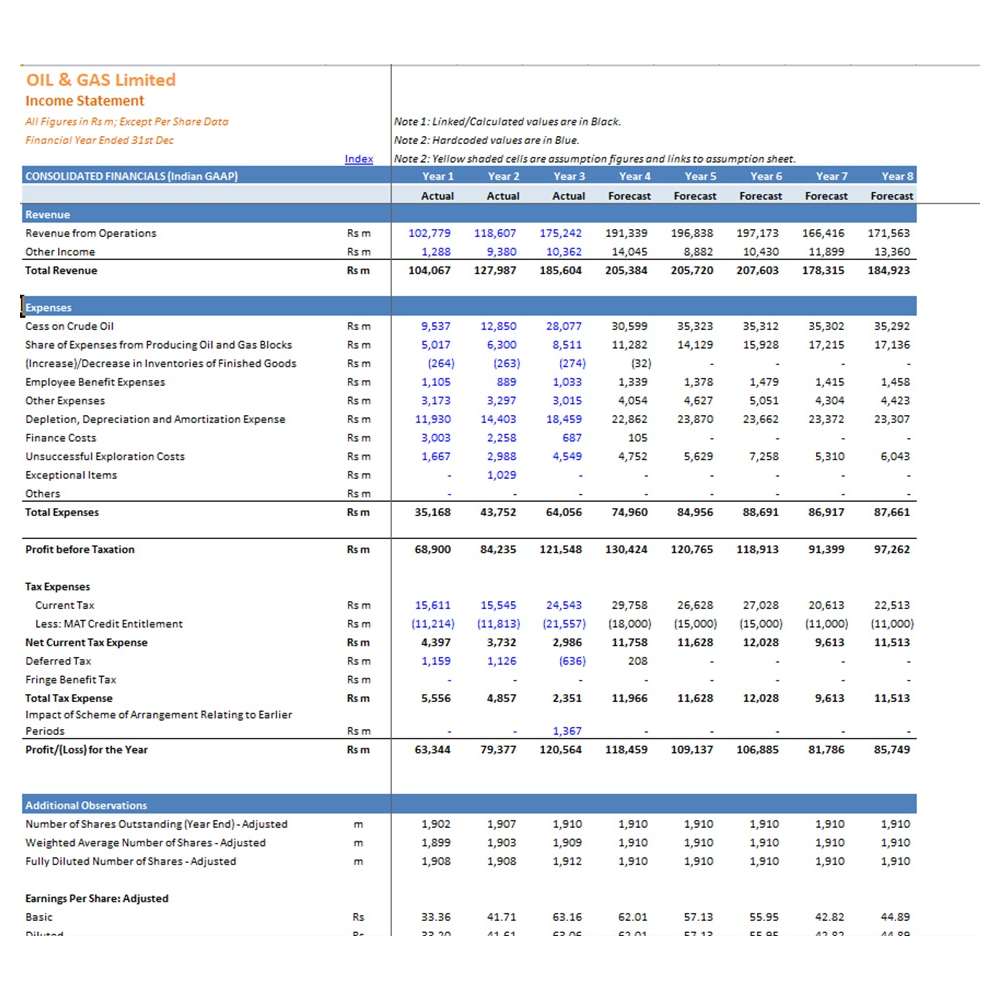
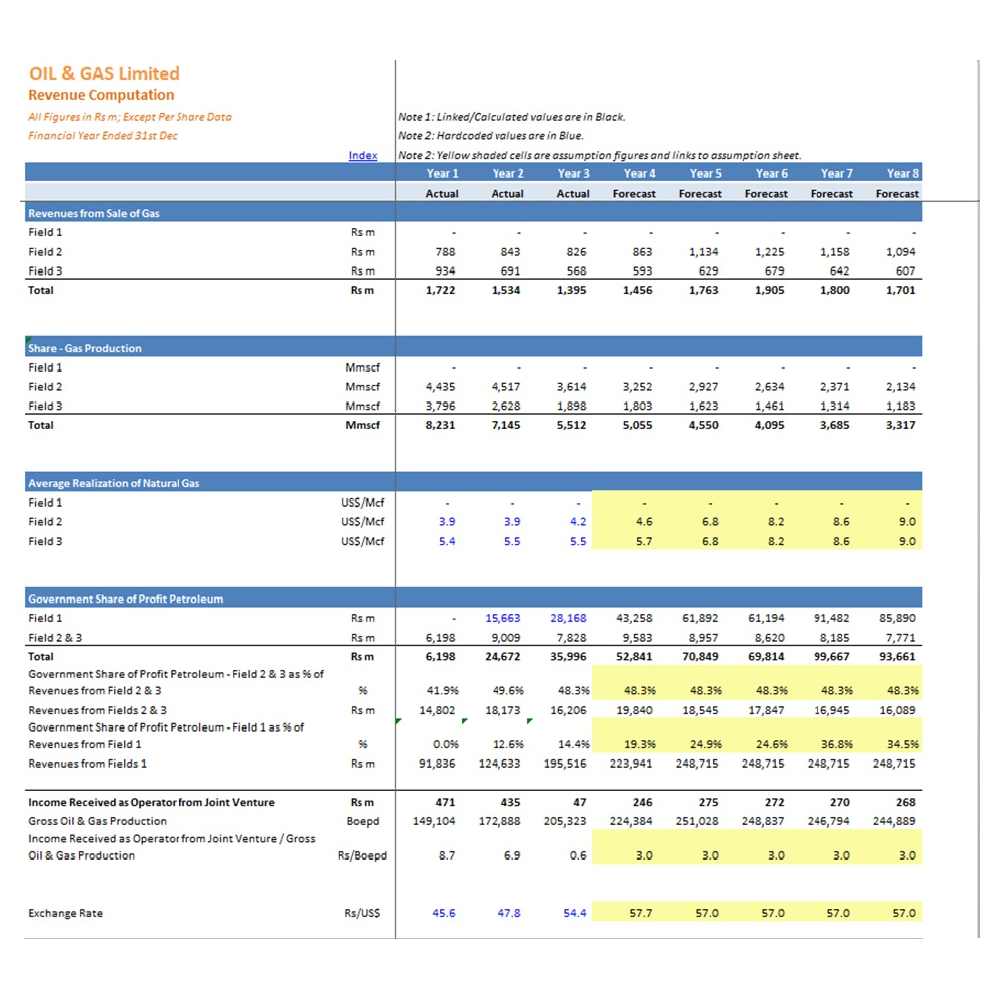
This model builds revenue from capacity, production, sales volume and unit price, so utilisation becomes a variable you can actually flex. Cost assumptions separate production cost from royalty, which matters in a sector where fiscal terms and offtake arrangements often drive the outcome as much as operating performance does.
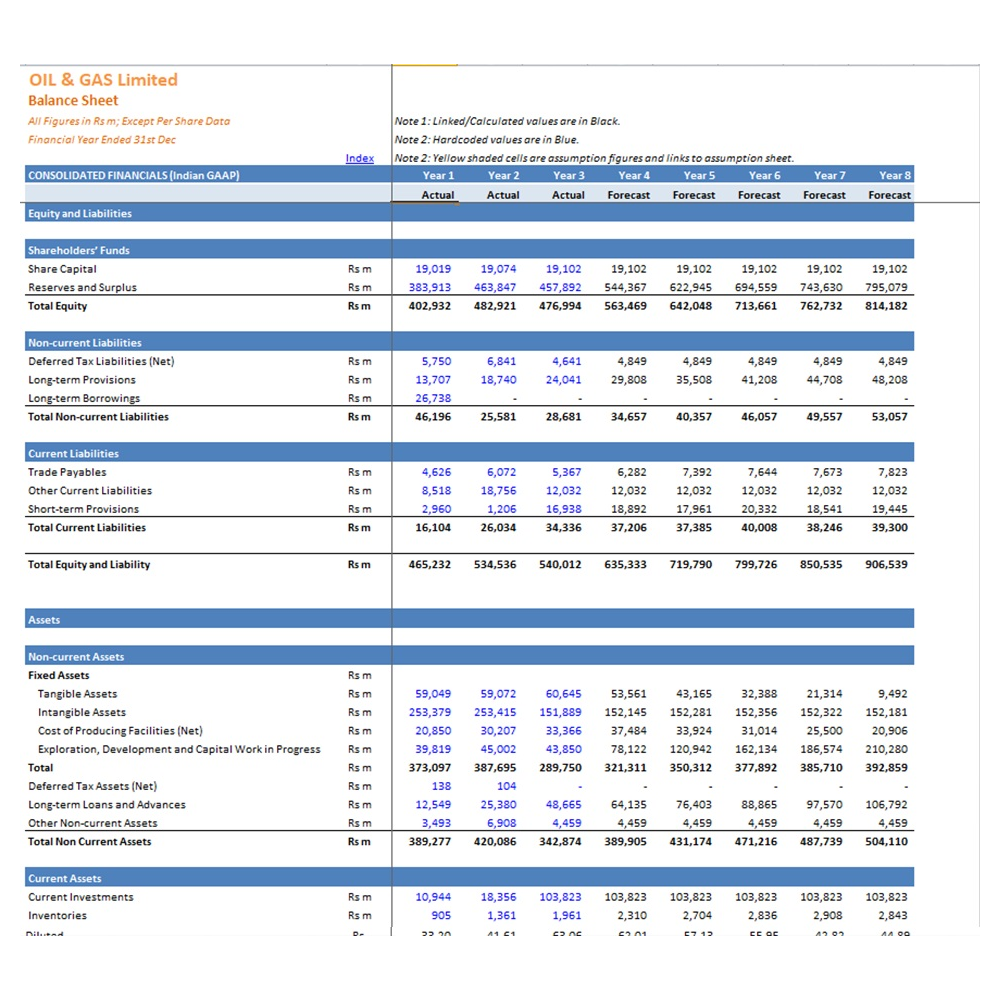
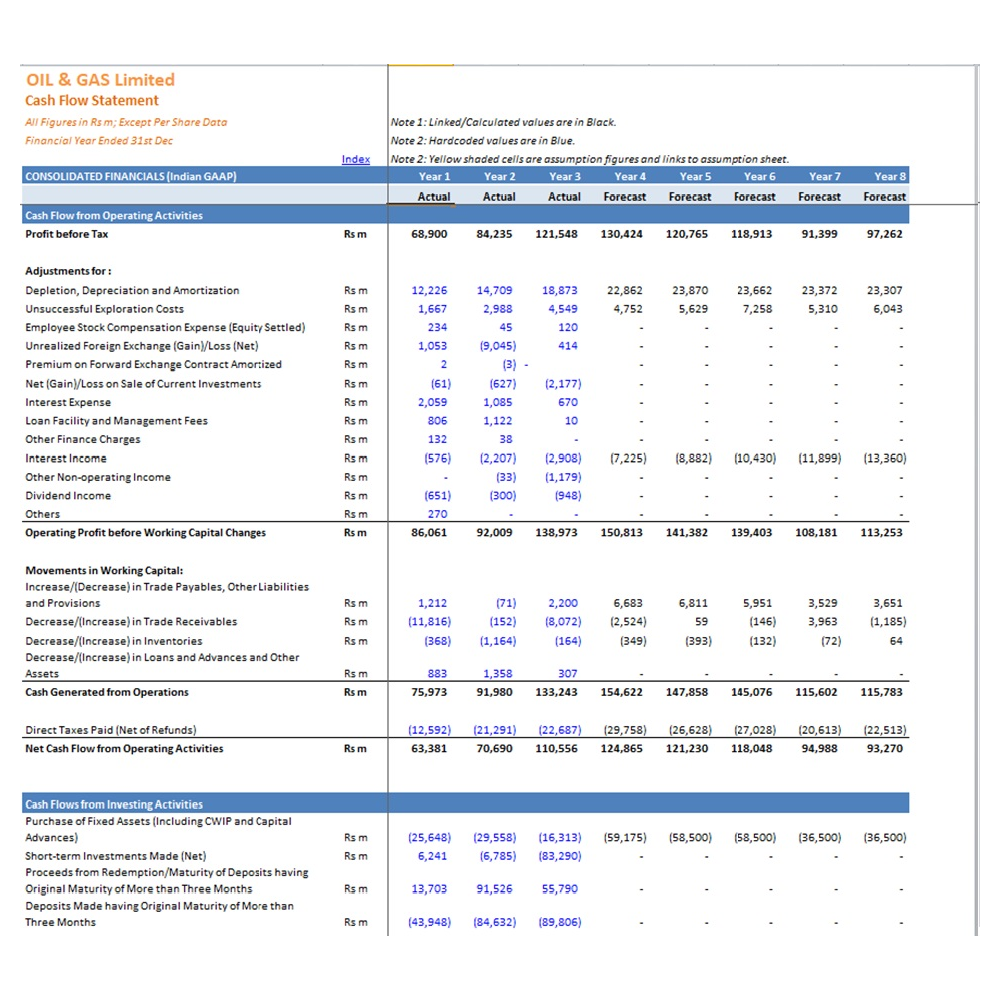
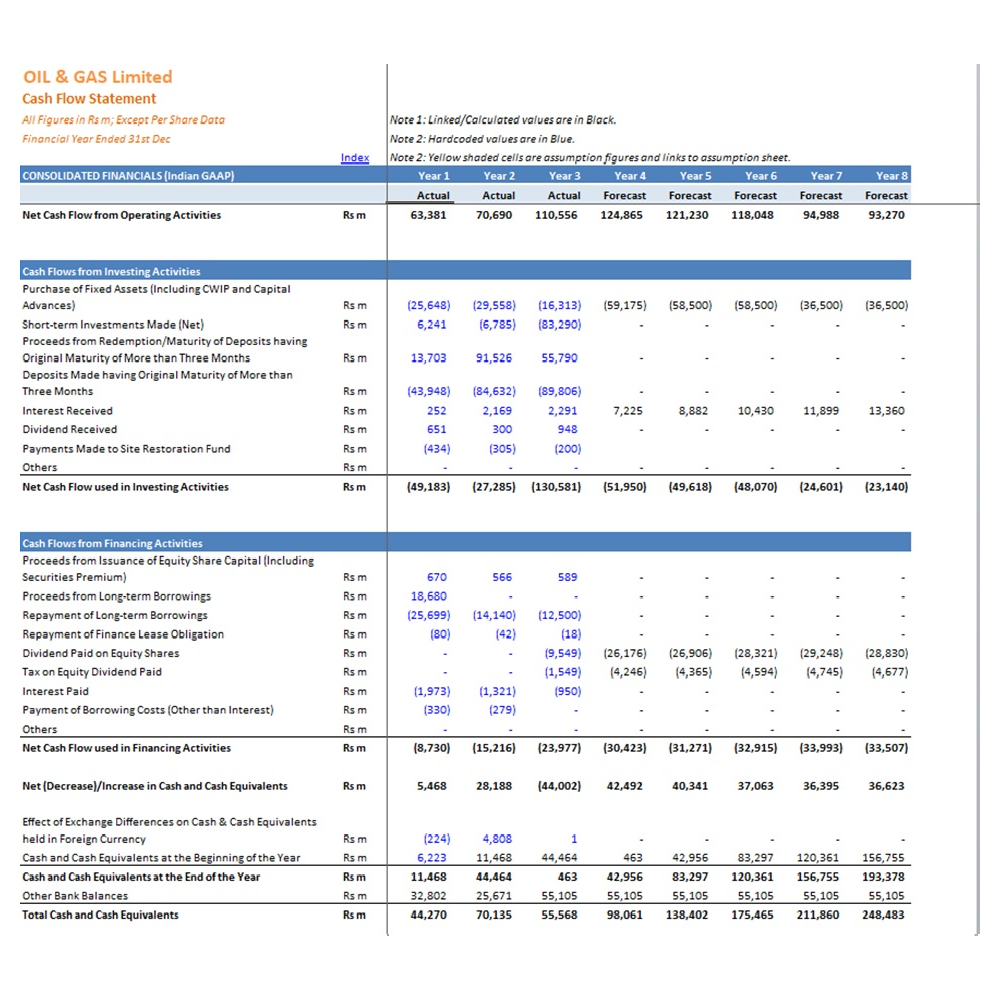
The model covers 3 years of historical data plus a 5-year forecast period. Valuation is derived from the forecast using discounted cash flow methodology, with terminal value and discount rate assumptions fully under your control.
Downstream assets consume capital continuously — turnarounds, upgrades, environmental compliance and maintenance capex all compete for the same cash. The model gives capital expenditure and depreciation their own detailed treatment across tangible and intangible assets, so you can see how the reinvestment burden affects free cash flow and, in turn, the valuation.
Debt is modelled across both long-term and short-term facilities, with interest income and expense calculated separately. Given how leveraged downstream operators typically are, that separation matters: you can test how a refinancing or a rate movement flows through to equity value without rebuilding the schedule.
A single assumptions tab drives the entire model. Change an input and every statement, ratio and valuation output updates automatically. The inputs cover:
| Revenue | Capacity, production, sales volume and unit price |
| Costs | Production cost, royalty and other operating expenses |
| Income Tax | Effective and statutory tax treatment |
| Working Capital | Receivables, payables and inventory |
| Capex & Depreciation | Tangible and intangible assets, with full amortisation schedules |
| Debt | Long-term and short-term borrowings |
| Share Capital | Issue of new shares and reserve accounts |
| Dividends | Interim and final dividend, including tax impact |
| Interest | Interest income and interest expense calculations |
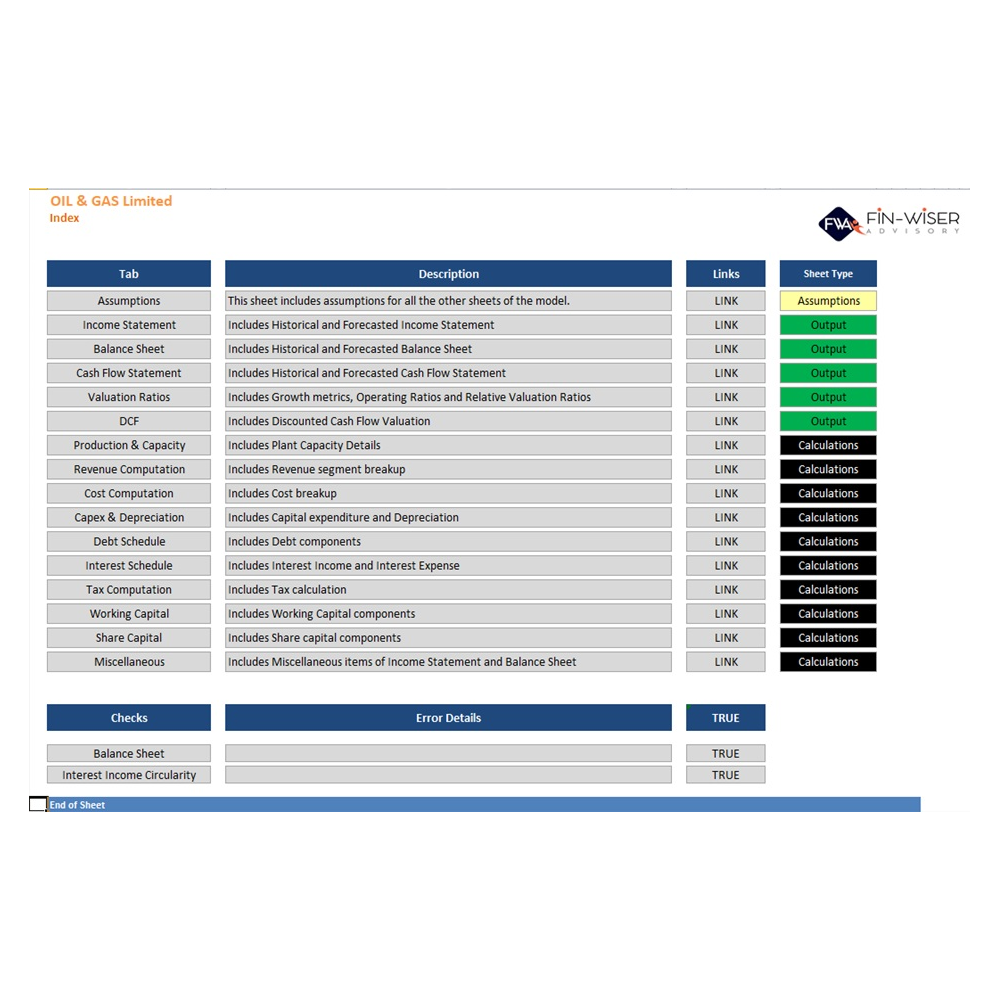
Comprehensive calculations run off your inputs to generate a complete set of outputs:
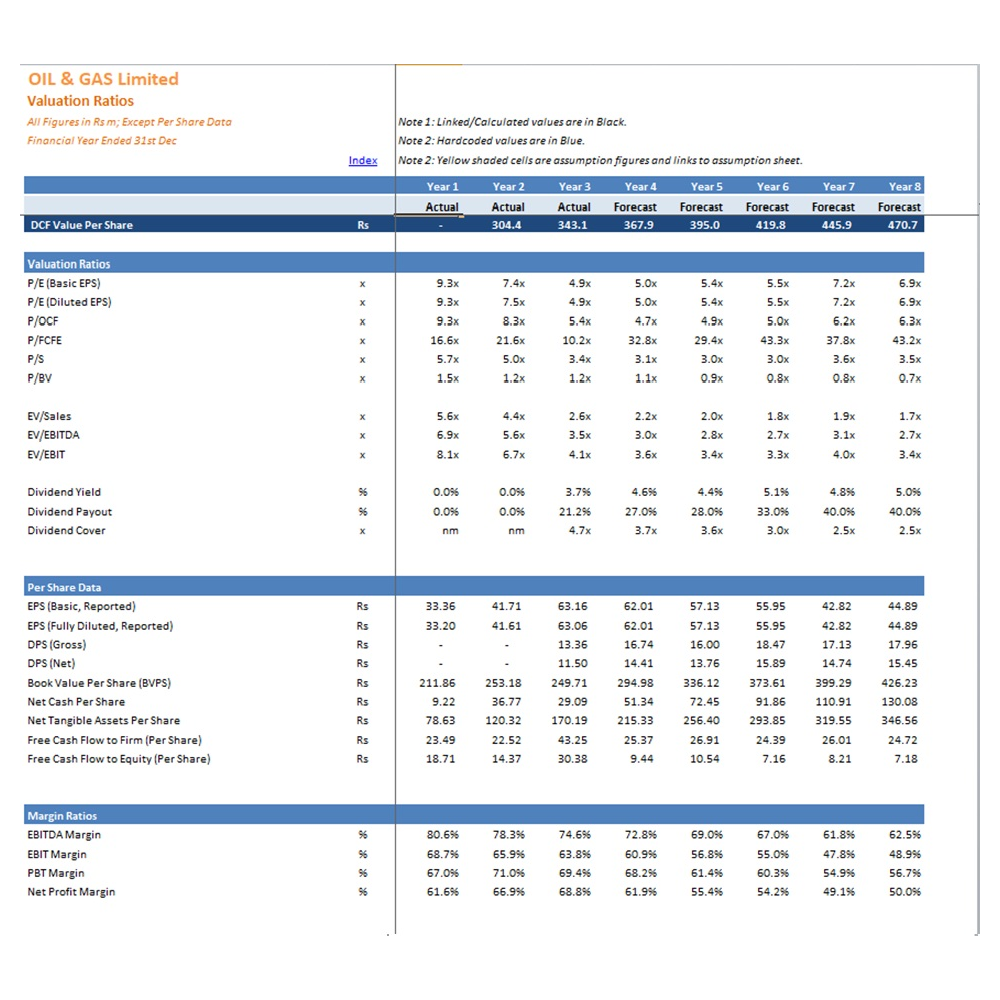
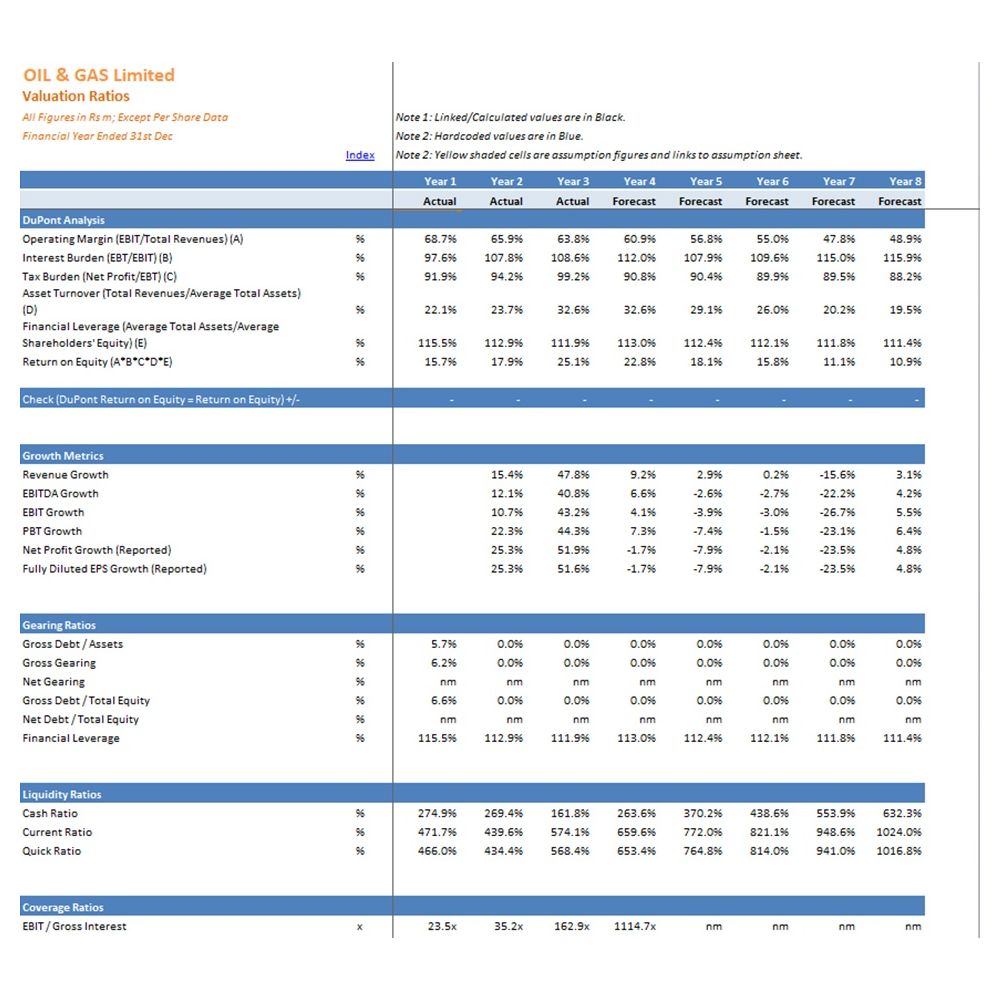
The analysis sheet goes considerably beyond a standard ratio summary, giving you the metrics an analyst would expect in a full valuation pack:
Price and EV-based valuation ratios, enterprise value, plus per-share data including EPS, DPS and FCFF per share.
Margin ratios, return ratios and a full DuPont decomposition of ROE into its operating, efficiency and leverage components.
Gearing ratios, liquidity ratios and coverage ratios — central to any downstream operator carrying significant debt.
Activity ratios covering asset and working capital efficiency, plus investment ratios for shareholder analysis.
Revenue builds from capacity, production and sales volume, so utilisation is a lever you can pull rather than an assumption buried in a growth rate.
Royalty sits apart from production cost, so fiscal terms can be stressed independently of operating performance.
Every formula is visible and traceable. Audit the logic, adapt it to your own asset base, or use it to see how a proper DCF is constructed.
Need a model built to your own specification? See our financial advisory services, or browse the full range of DCF valuation templates.
Capacity and production-driven revenue, three years of history, a five-year forecast, DCF valuation and a complete ratio pack.