$120.00
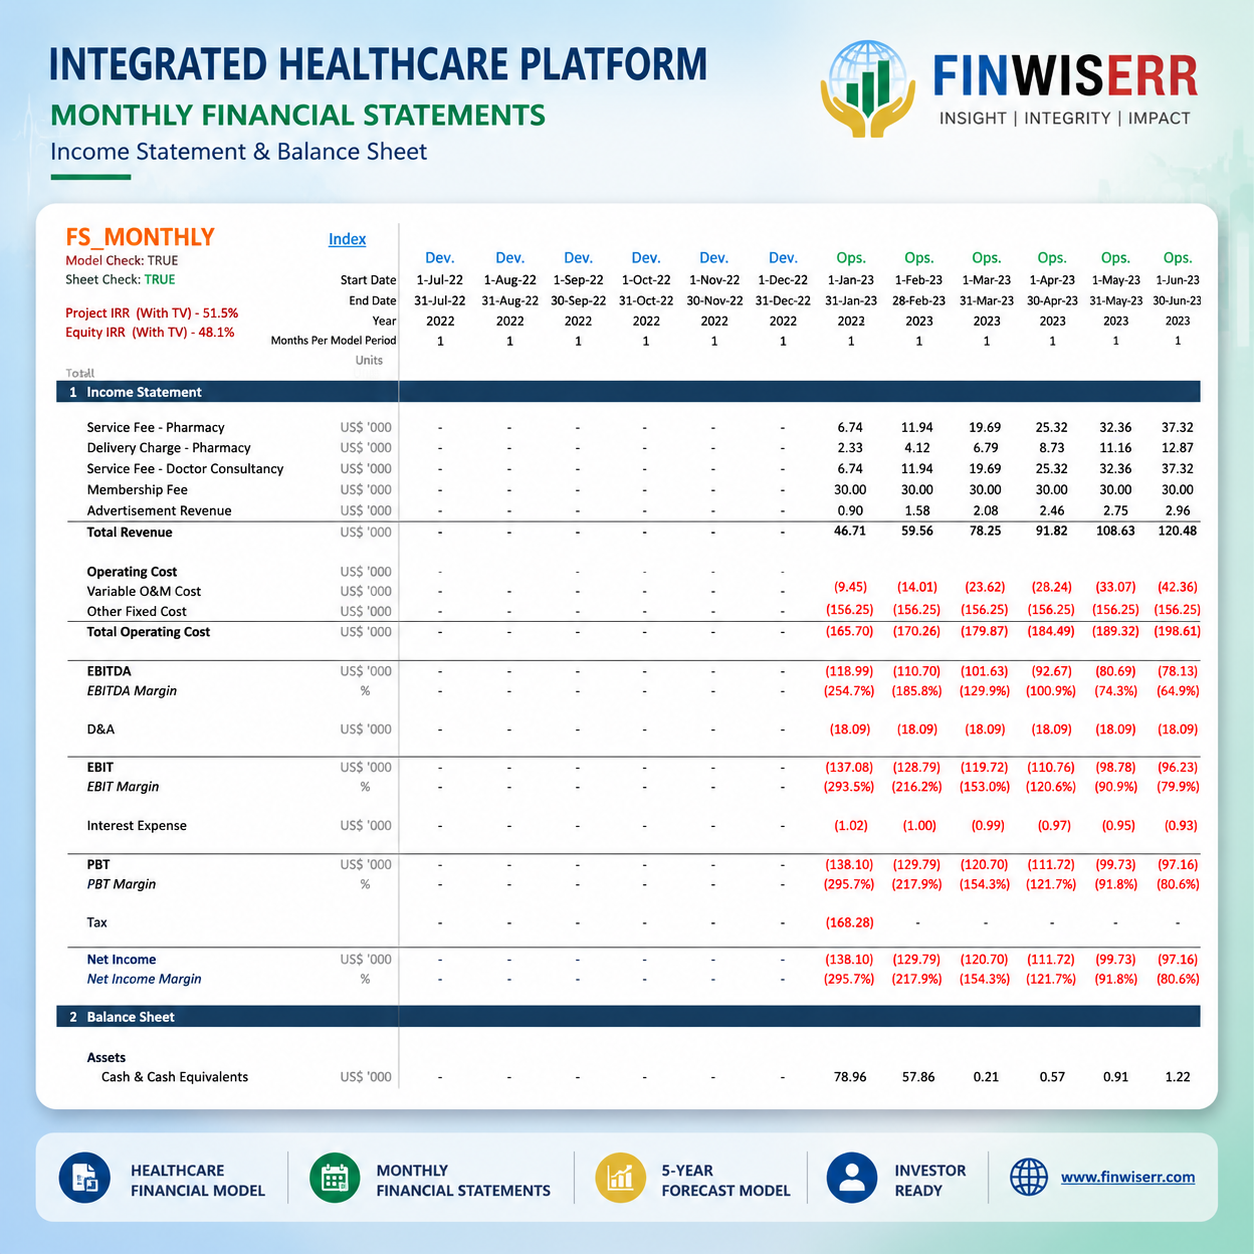
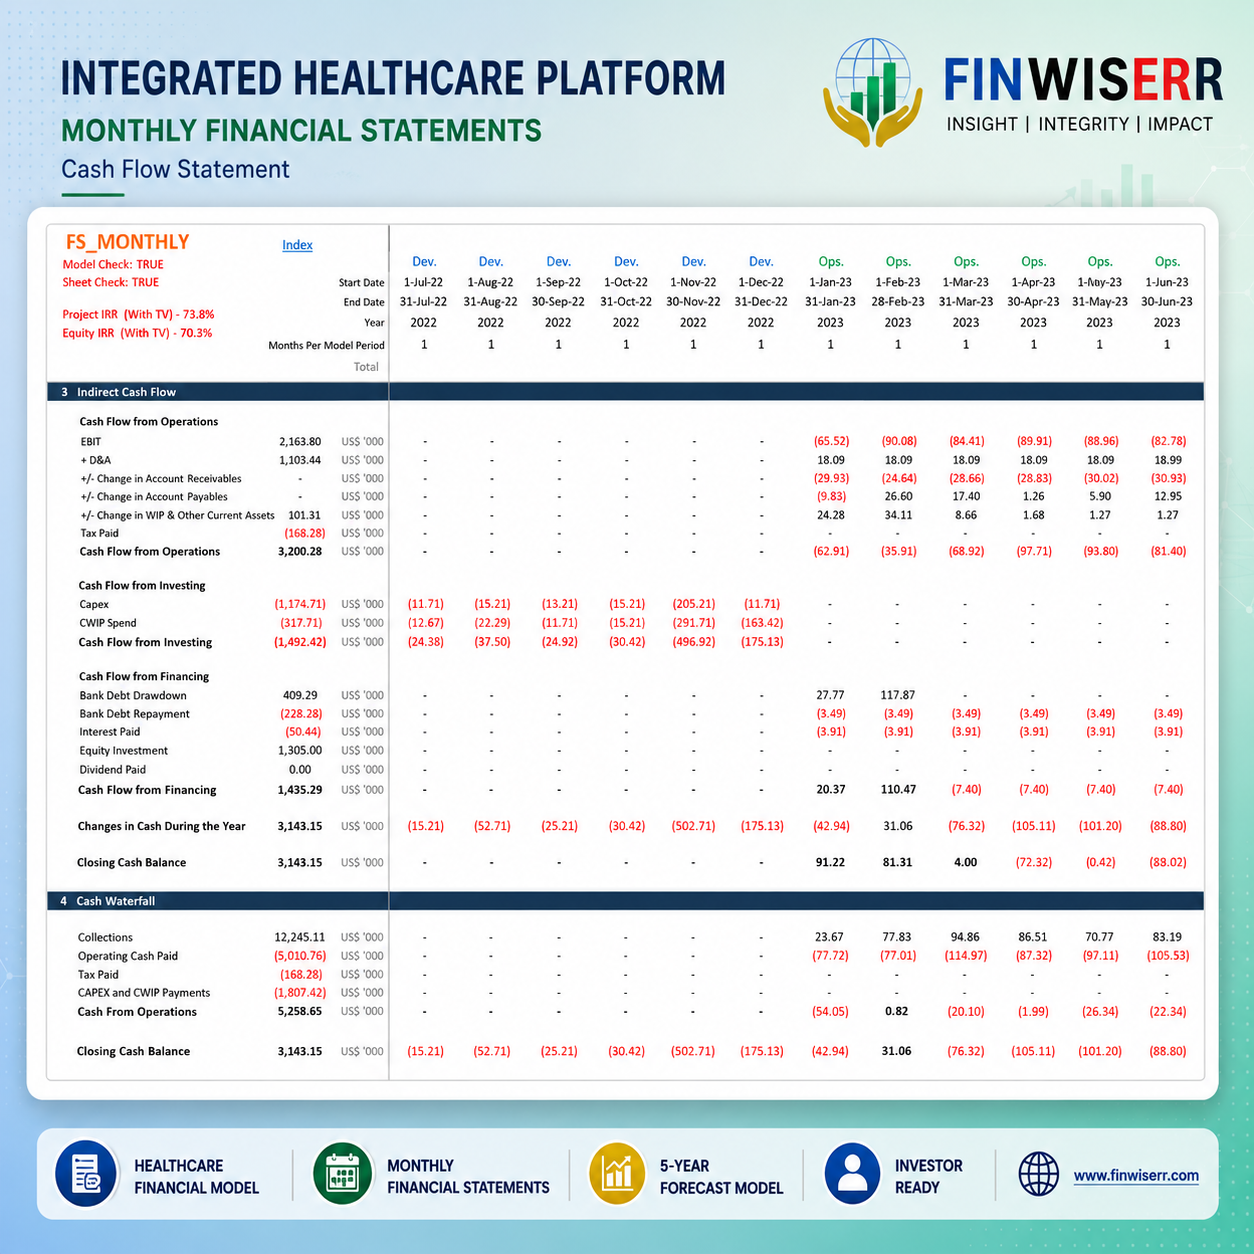
A detailed, investor-ready healthcare platform financial model for an integrated telehealth and e-pharmacy marketplace — with a user acquisition and retention funnel, a dual partner network of pharmacies and doctors, and four distinct revenue streams, plus app-development and operation phases, break-even analysis and valuation, in one integrated Excel model.
An integrated healthcare platform is a marketplace with two supply sides working at once. On one, pharmacies fulfilling medicine orders; on the other, doctors taking consultations. Both are matched to the same base of users, and both monetise differently — a commission and delivery fee on pharmacy orders, a consultancy fee on doctor appointments. Layer membership and advertising on top, and you have a business whose economics only make sense when each side is modelled on its own terms.
This healthcare platform financial model is built for that structure. Revenue is driven from a user funnel — downloads, retention and active-user rates — meeting a partner network of pharmacies and doctors that grows month by month, monetised through four separate streams. App development is treated as the capitalised, amortised intangible it genuinely is, and the whole platform flows through to a complete, investor-ready output set.
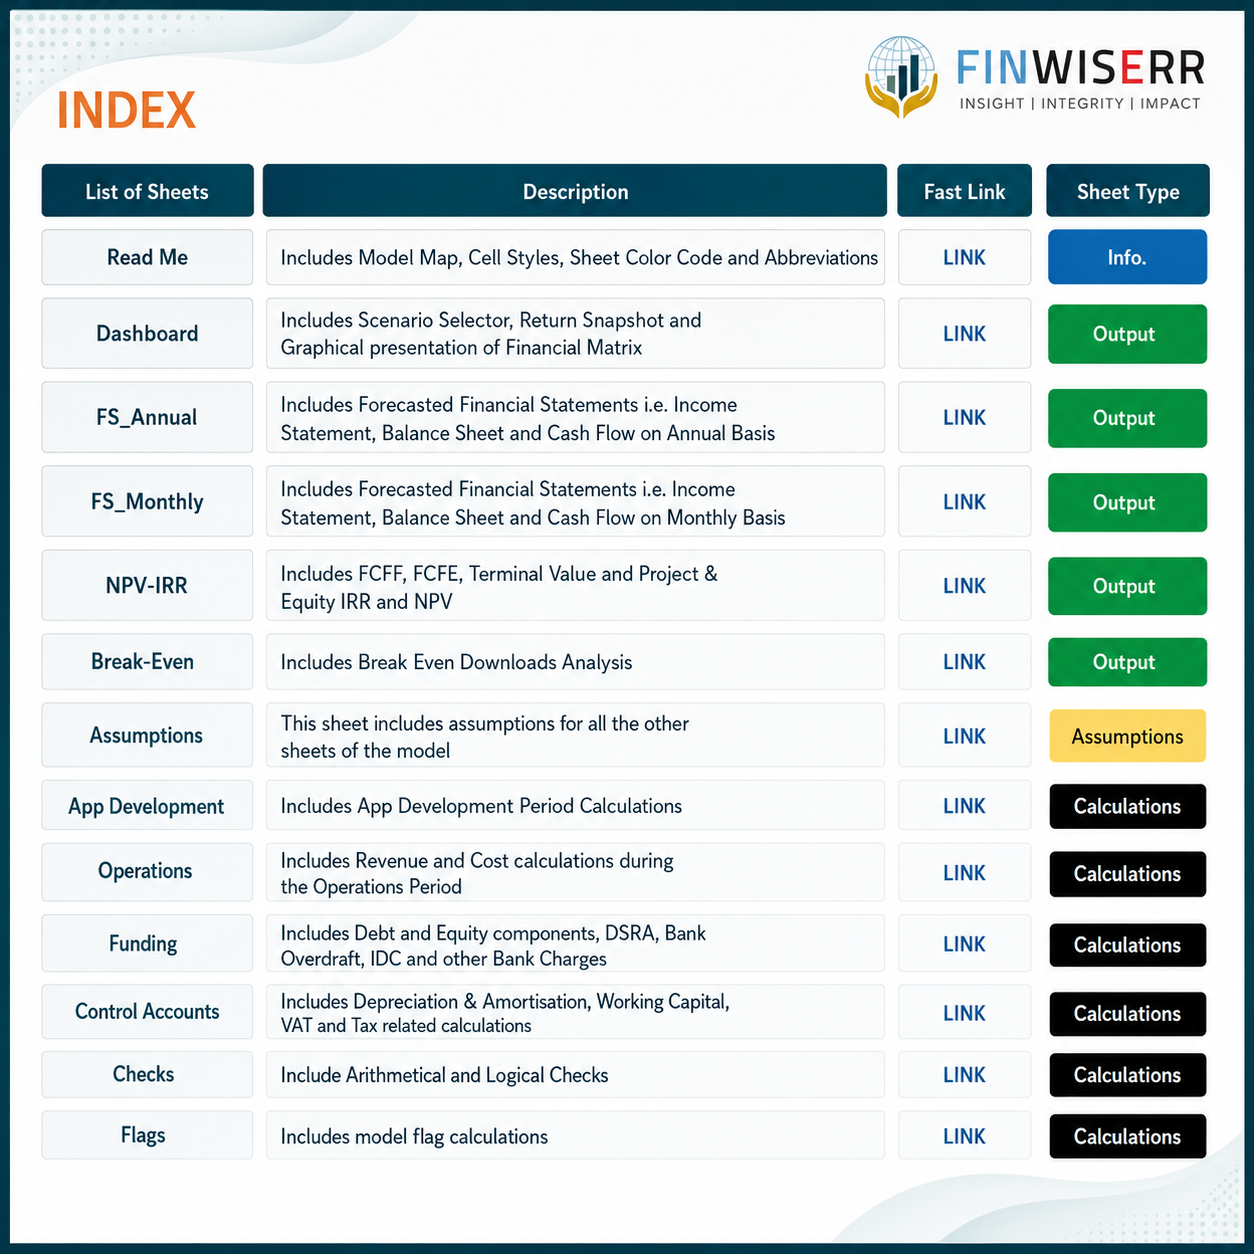
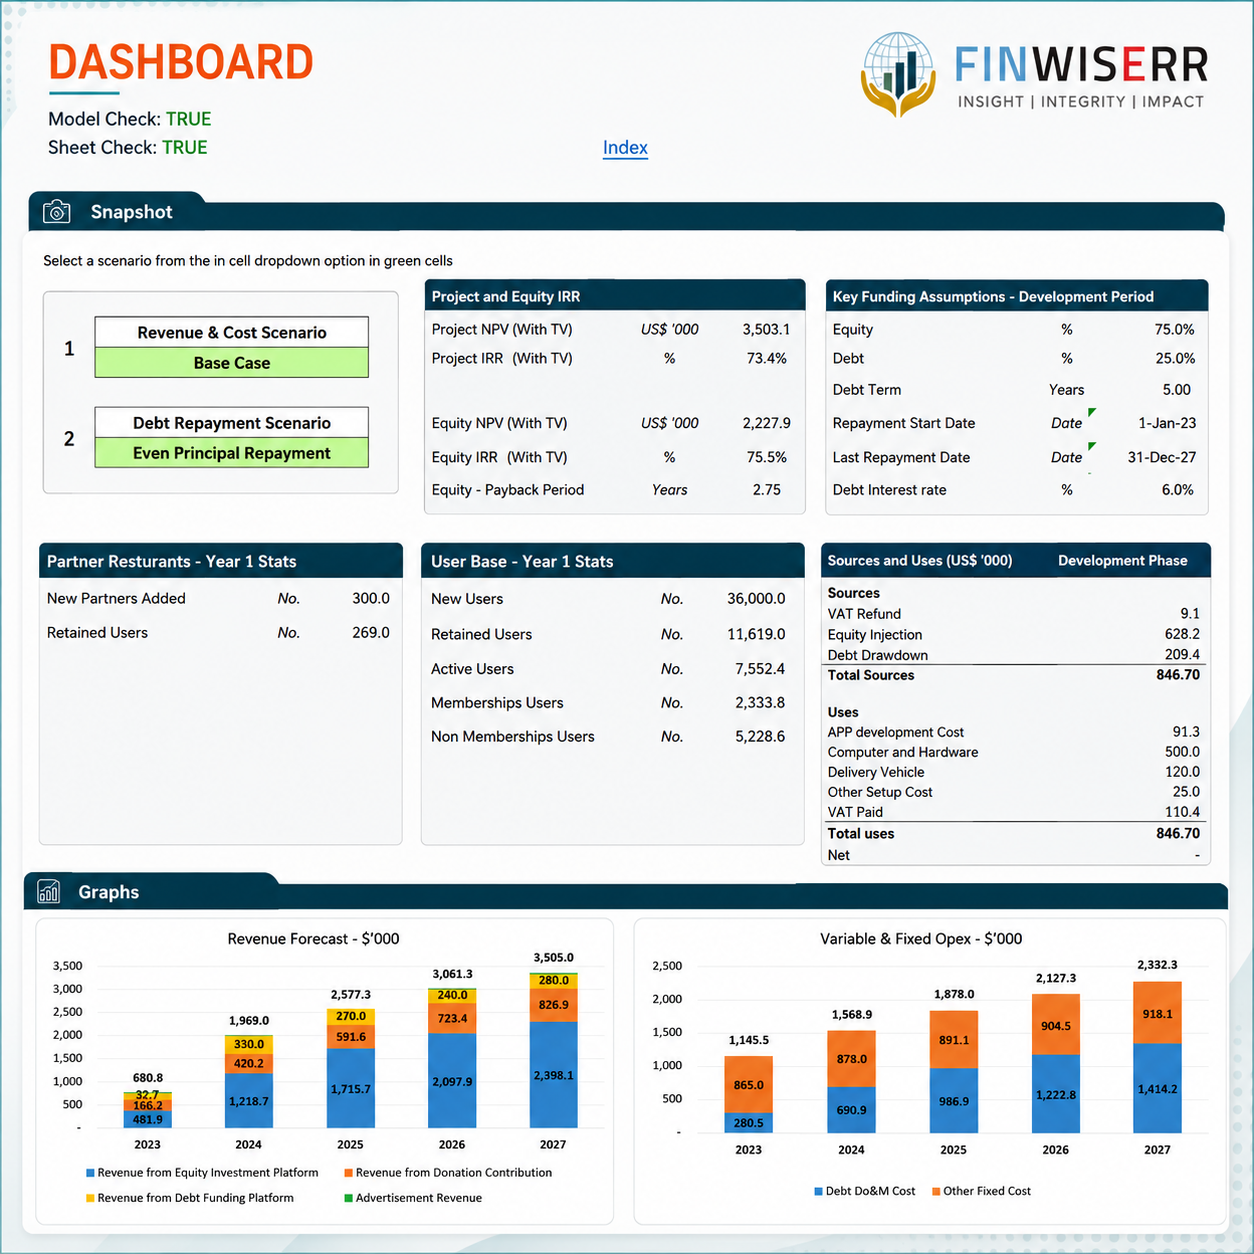
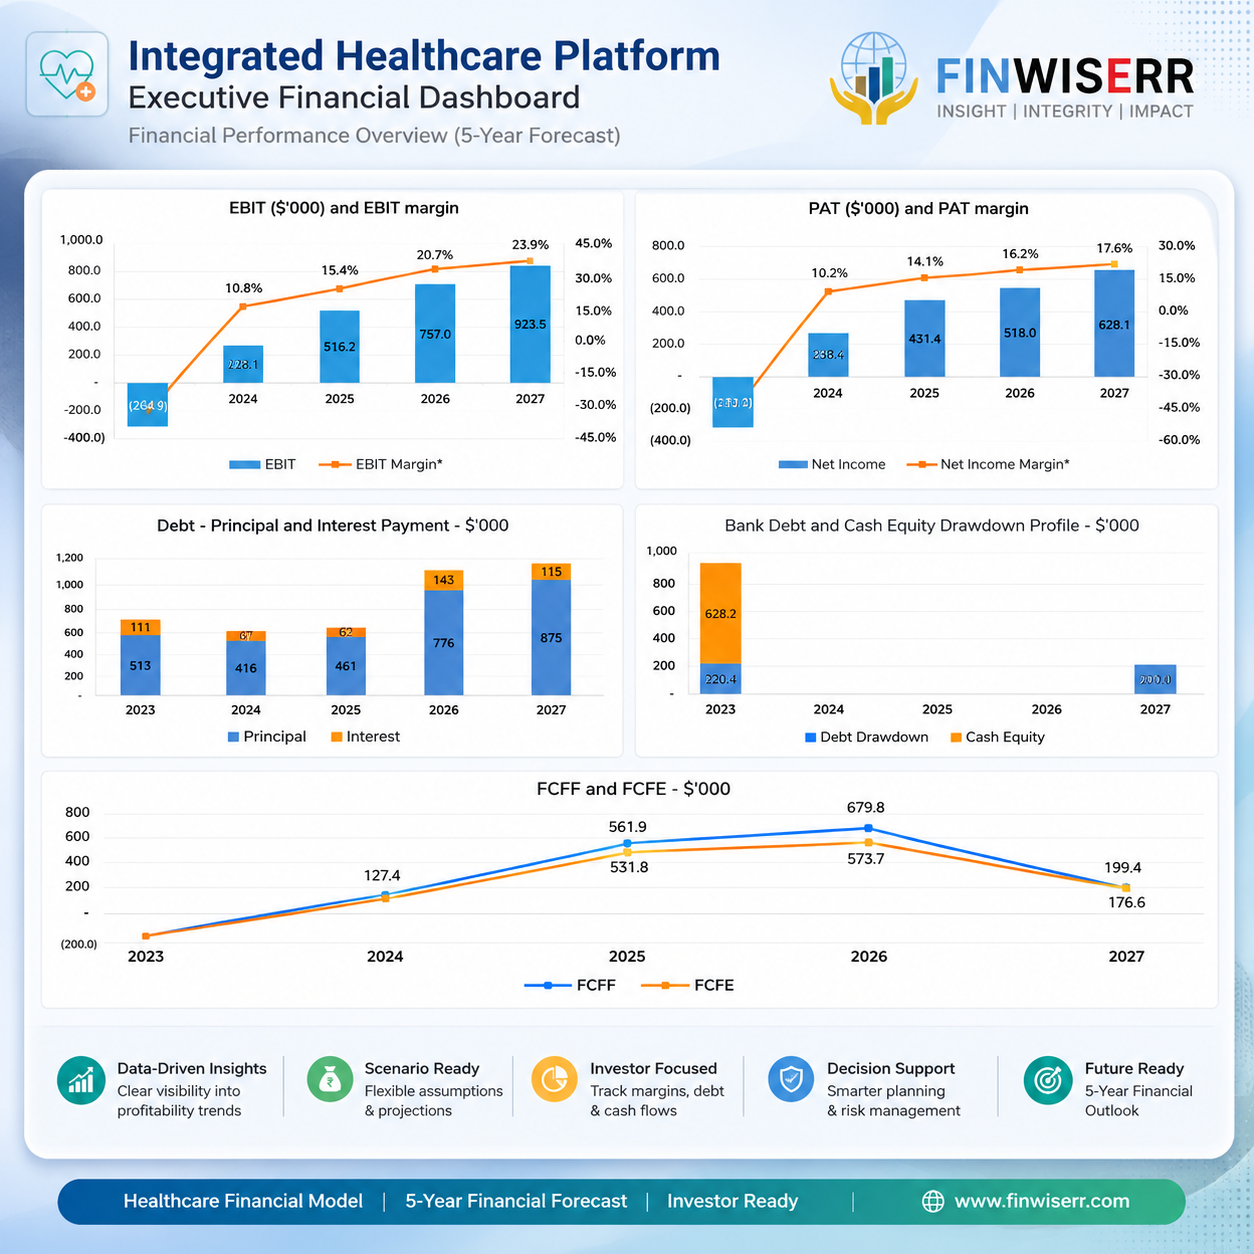
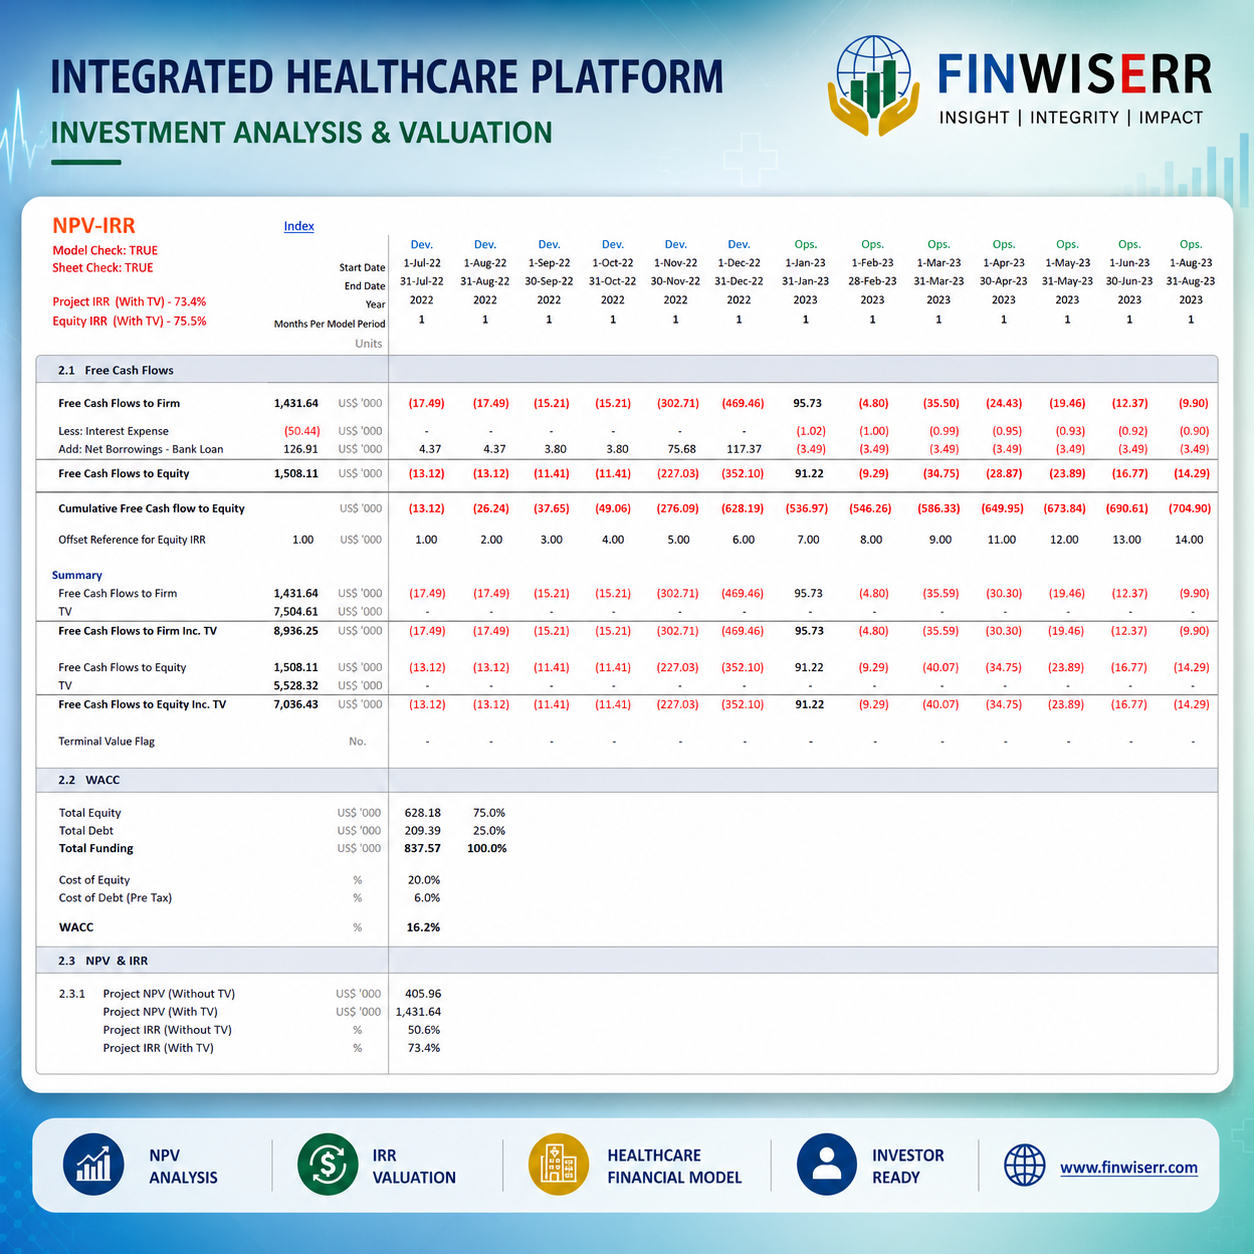
The output set is comprehensive: Project and Equity IRR and NPV (with and without terminal value), equity payback, break-even analysis, a DCF valuation and a fully linked dashboard.
The model builds its user base the way a platform actually grows one: app downloads and web users added each month, a compounding monthly retention rate, and an active-user percentage applied to those retained. That funnel meets two distinct supply sides — partner pharmacies and partner doctors — each added month by month and each contributing its own volume.
Modelling the two networks separately is what makes this an integrated healthcare model rather than a generic delivery one. A platform tilted toward pharmacy fulfilment has very different unit economics from one built on doctor consultations, and being able to test the balance between them — and the pace at which each network scales — is exactly the analysis a healthtech founder and investor need.
The model captures every way the platform earns, separately:
Separating these lets you tell a credible monetisation story — early platforms lean on transaction fees, while mature ones increasingly earn from membership and advertising. Showing that evolution, and quantifying it, is what a healthtech investor looks for.
Every driver of the platform is an explicit, editable input. The assumptions cover:
| User Base | App downloads and web users per month, monthly retention rate and active-user percentage |
| Partner Networks | Partner pharmacies and partner doctors, each added per month |
| Pharmacy Revenue | Orders per pharmacy per day, average order value, service fee percentage and delivery charge |
| Doctor Revenue | Appointments per doctor per day and average consultancy fee |
| Membership & Ads | Membership take-up and annual price; sessions, minutes, ad impressions and CPM |
| Rider Costs | Deliveries per rider per day, rider salary, fuel cost and other rider cost |
| Fixed Costs | Management salary, technical and other staff, rental, office expenses, SPV cost, insurance and security |
| App Development Capex | UI/UX, native Android and iOS, backend, admin panel, DevOps and project management, amortised as an intangible |
| Financing | Debt-equity ratio, development and operations debt, term and repayment schedule |
The primary capital outlay for a healthcare platform is its app, and the model treats it correctly. App development cost — across UI/UX, native Android and iOS, backend, admin panel and DevOps — is capitalised as an intangible and amortised over its useful life, with refresh capex to fund the periodic rebuild. That treatment is what makes the early-year statements realistic and the valuation credible to an investor who understands how digital-health businesses are reported.
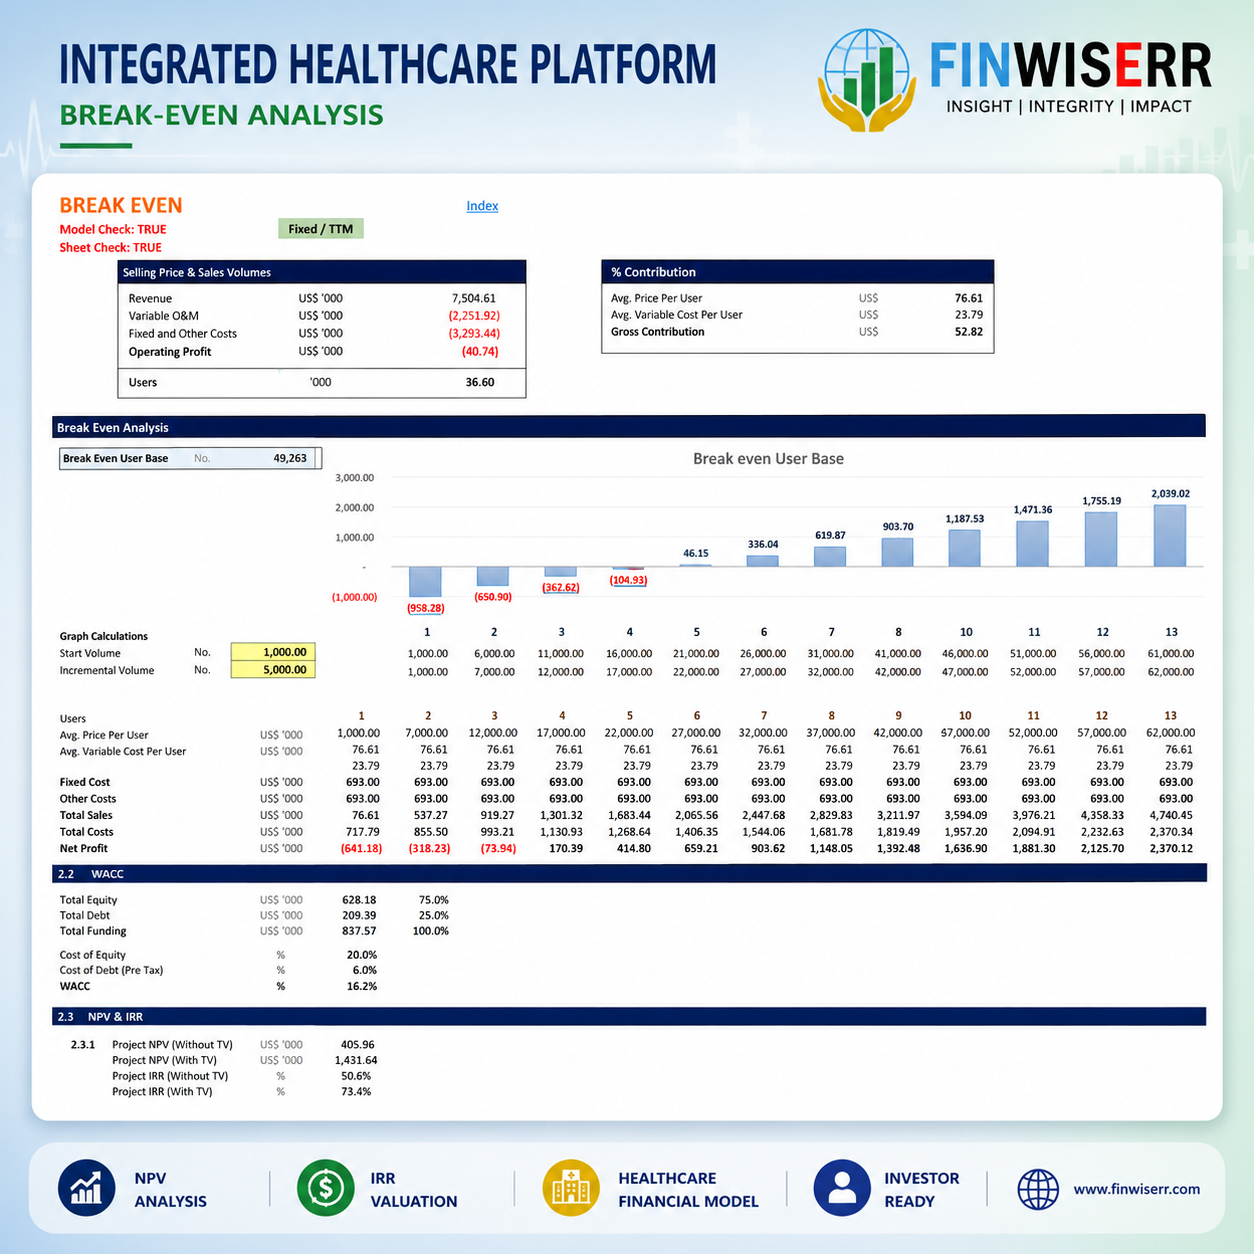
A dedicated break-even analysis shows when the platform’s revenue overtakes its cost — the milestone every marketplace investor probes, given how long two-sided businesses take to turn. Alongside it, a full DCF valuation derives Project and Equity NPV and IRR both with and without terminal value, so you can see how much of the value depends on the long-run exit versus the years in view.
The model forecasts across development and operation on a monthly basis, with financial statements on both monthly and annual views. Every revenue and cost assumption can be entered across three scenarios and switched at the click of a button, so a conservative retention case sits beside an aggressive-growth one — and because the model uses no macros, every change flows through instantly.
Two partner networks with their own revenue mechanics, so the integrated platform models as it actually operates.
Downloads, retention and active-user rates drive demand, so user economics are modelled honestly.
The month the platform turns, plus a full DCF valuation with and without terminal value.
New to these metrics? Read an overview of internal rate of return. For a model built to your own specification, see our financial advisory services, or browse the full range of business plan Excel models.
Pharmacy and doctor networks, four revenue streams, software amortised and a full valuation — five years of monthly projections, ready in Excel.