$149.00
A detailed, institutional-grade solar PV financial model for a solar plant project, capturing every essential input across construction, operation and financing — with three integrated statements, debt covenants, a cash waterfall and complete lender metrics, built in Excel.
A solar plant is a long-dated infrastructure asset financed against the cash flows it generates, which puts the entire weight of the investment case on the model behind it. Generation has to be forecast honestly across decades, revenue has to reflect the contract structure, and the debt has to be shown to service itself through every year — including the bad ones. A generic template cannot carry that load, which is exactly why solar projects need a model built to project finance discipline.
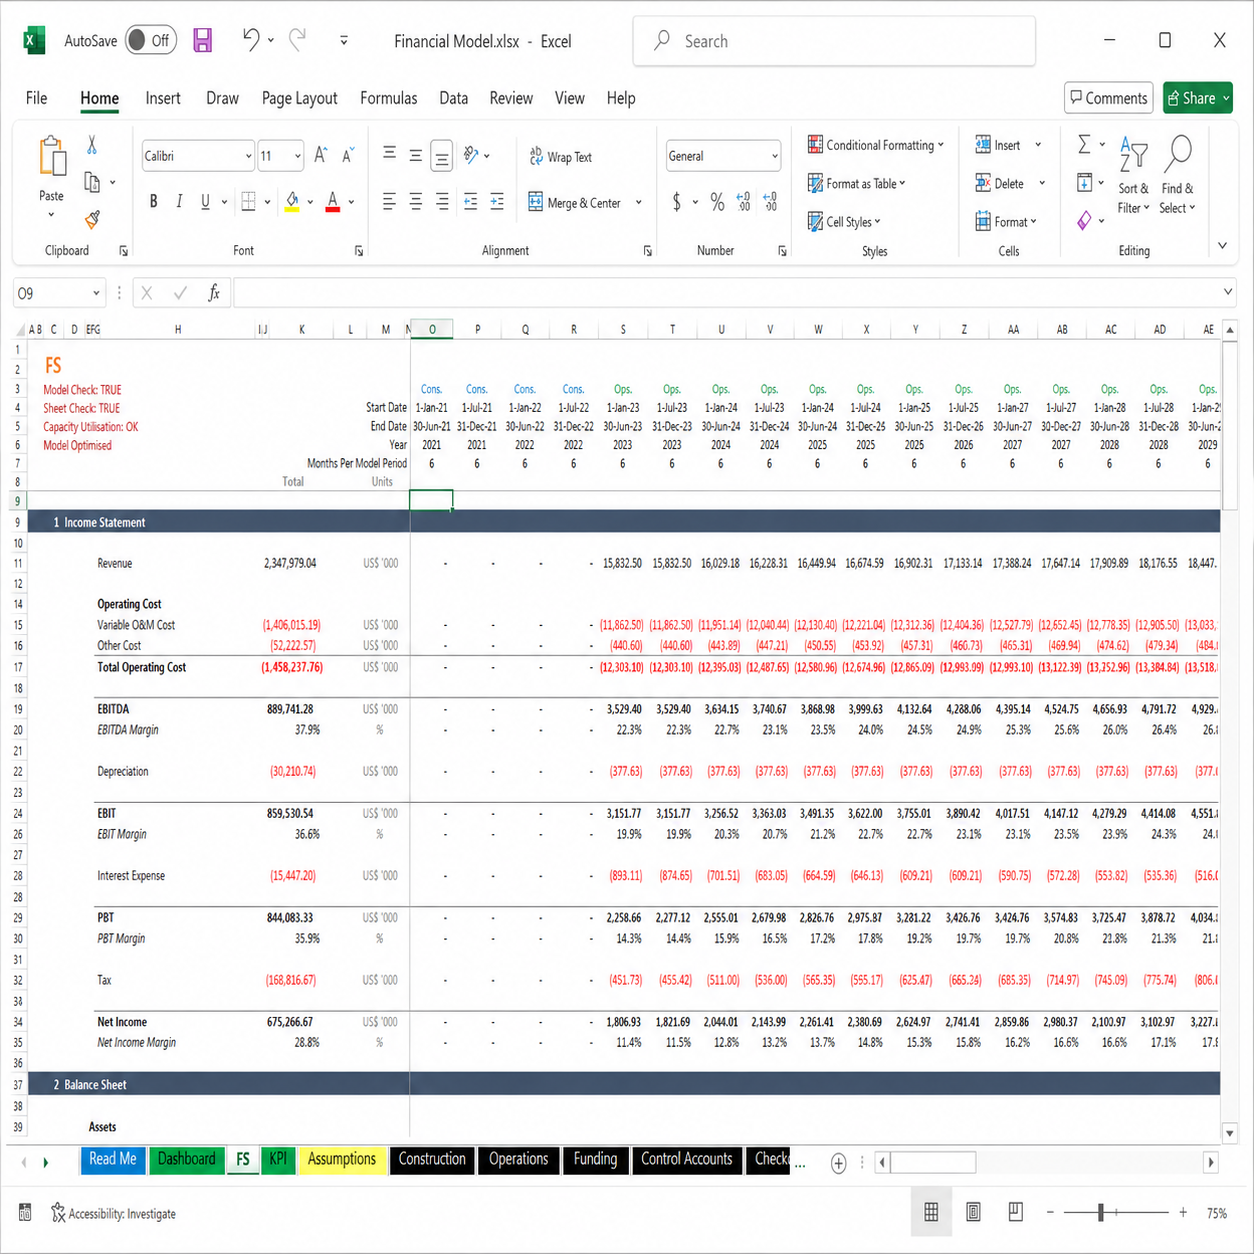
This solar PV financial model helps you assess the financial viability of a solar PV project by capturing all the essential inputs across construction, operation and financing — and resolving them into the metrics a developer, sponsor or lender needs to reach a decision.
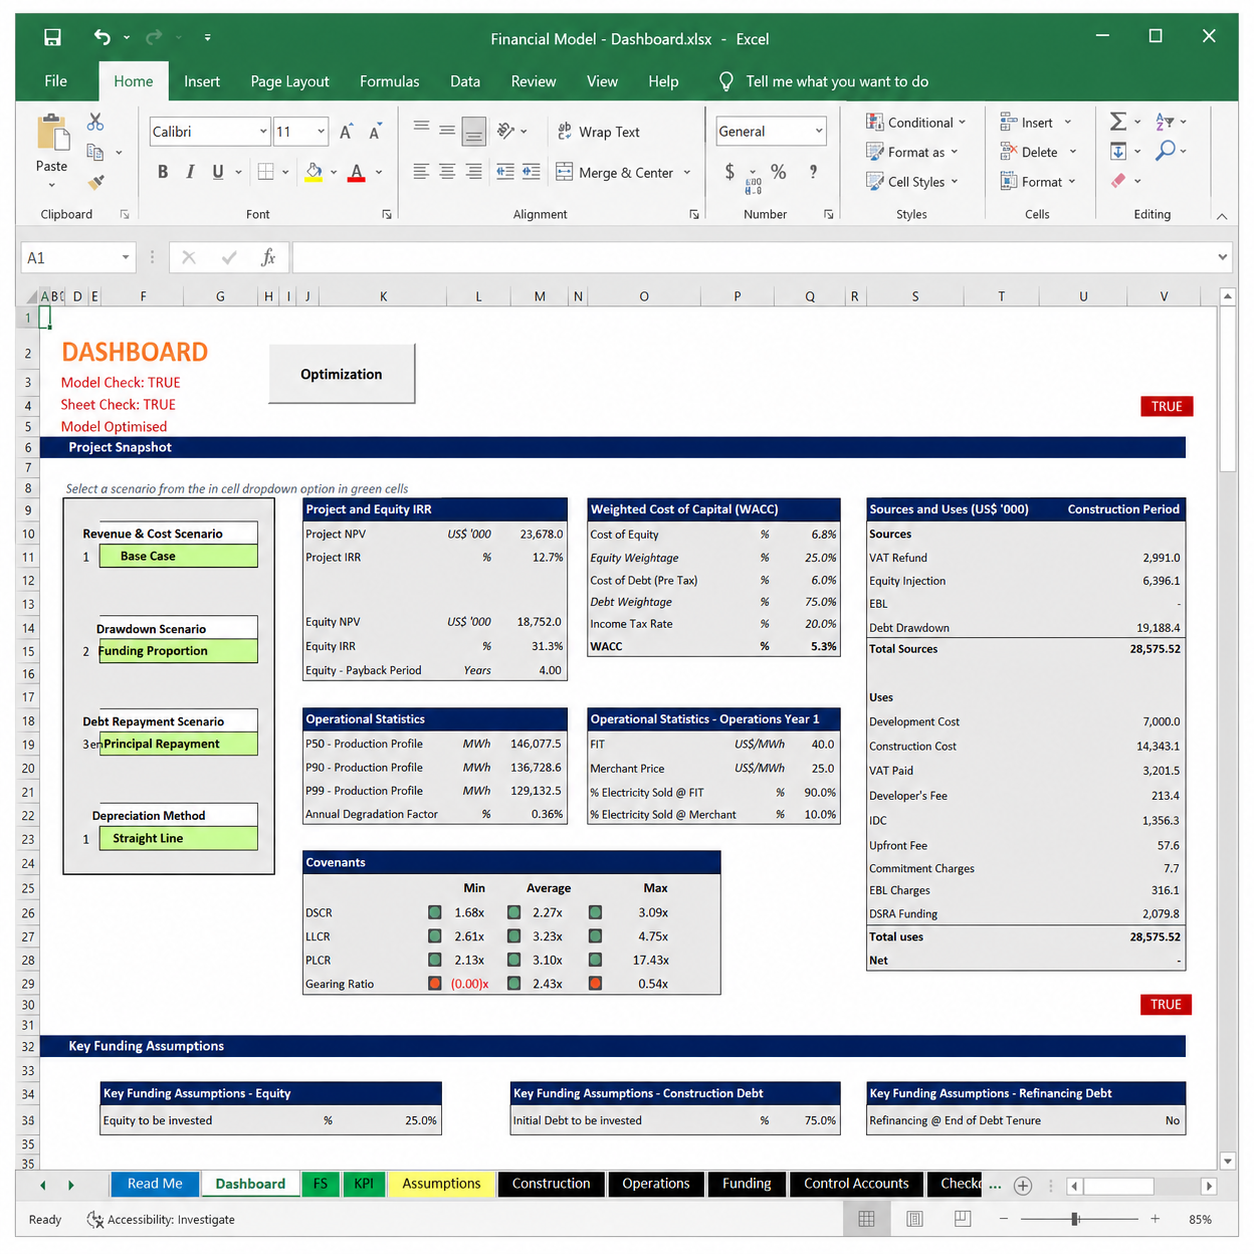
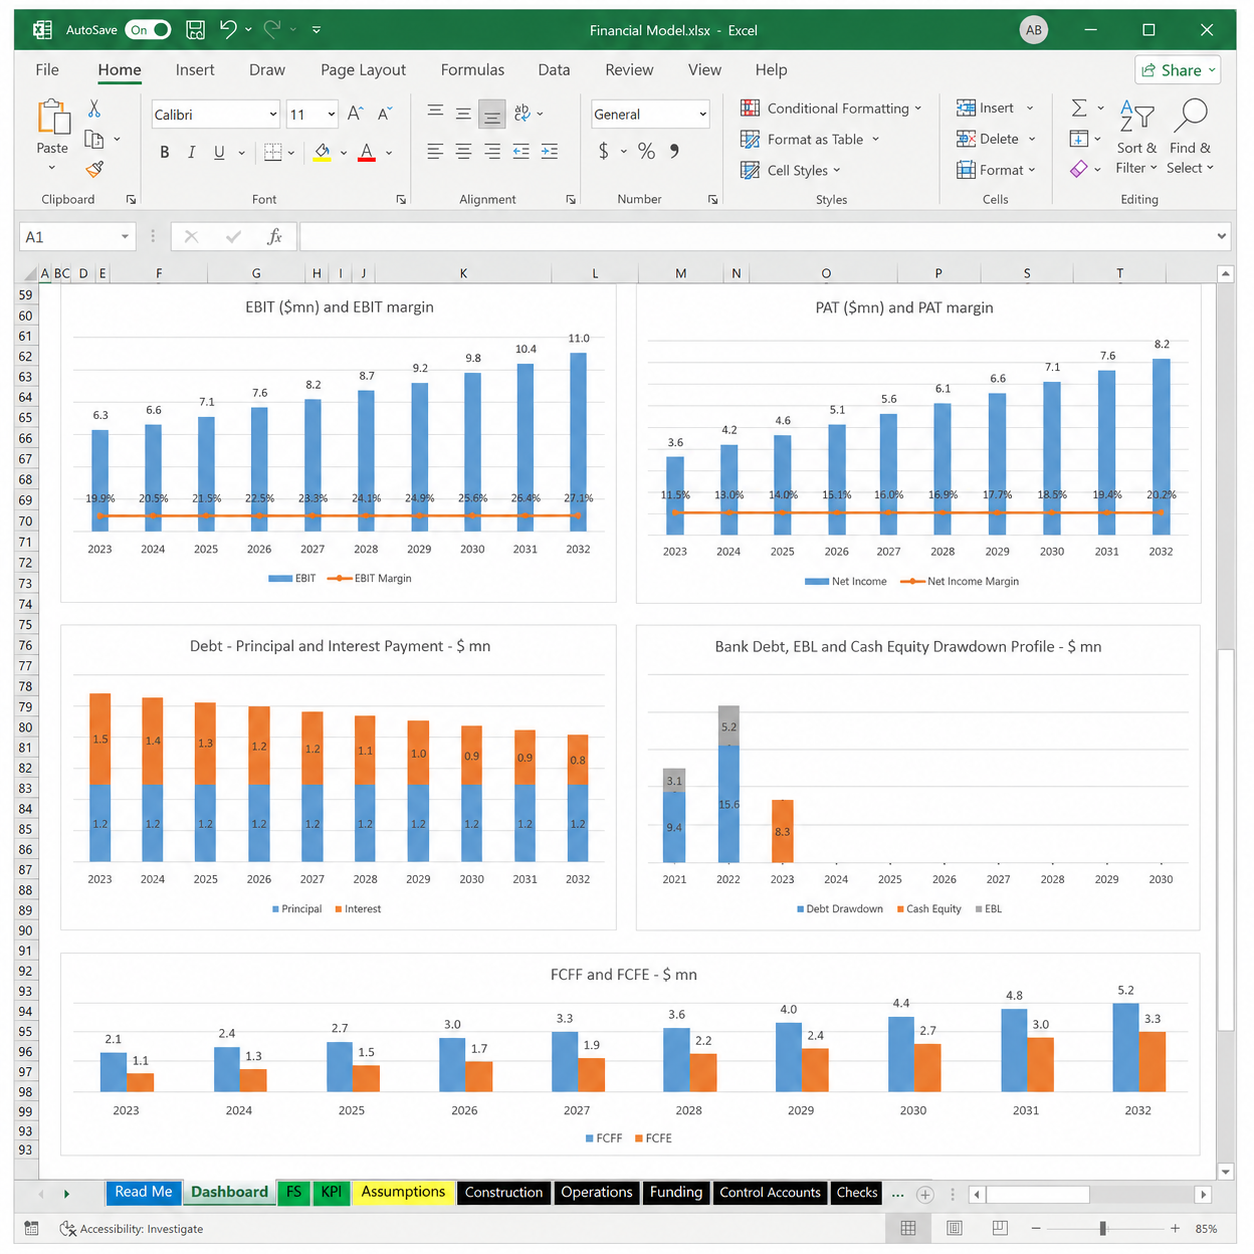
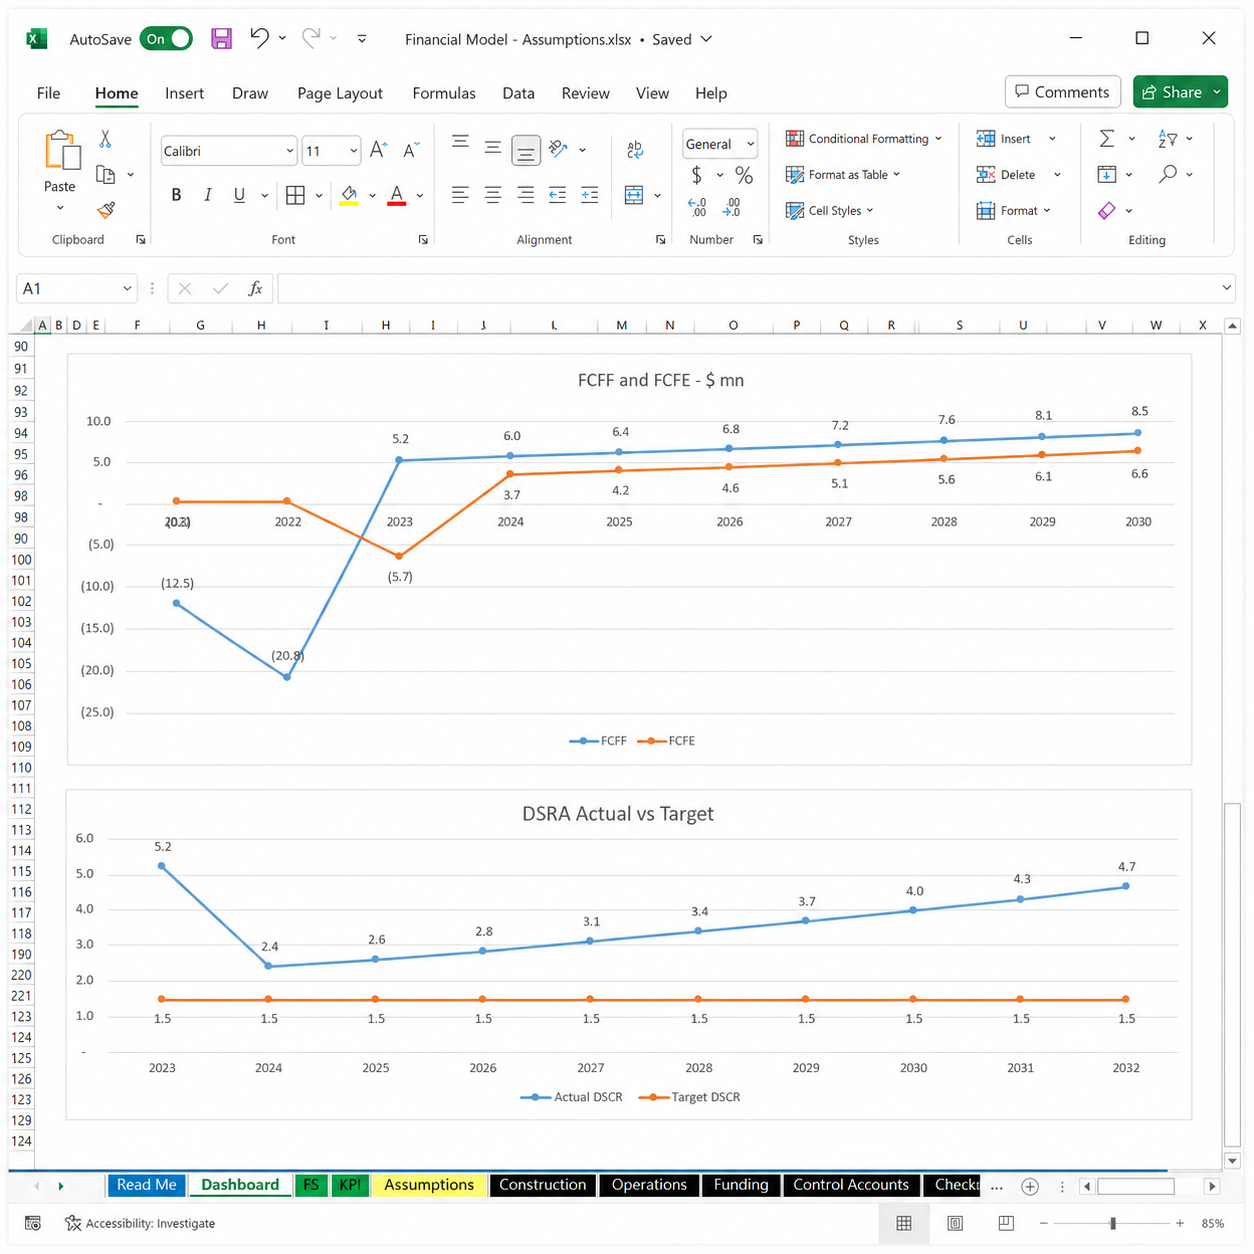
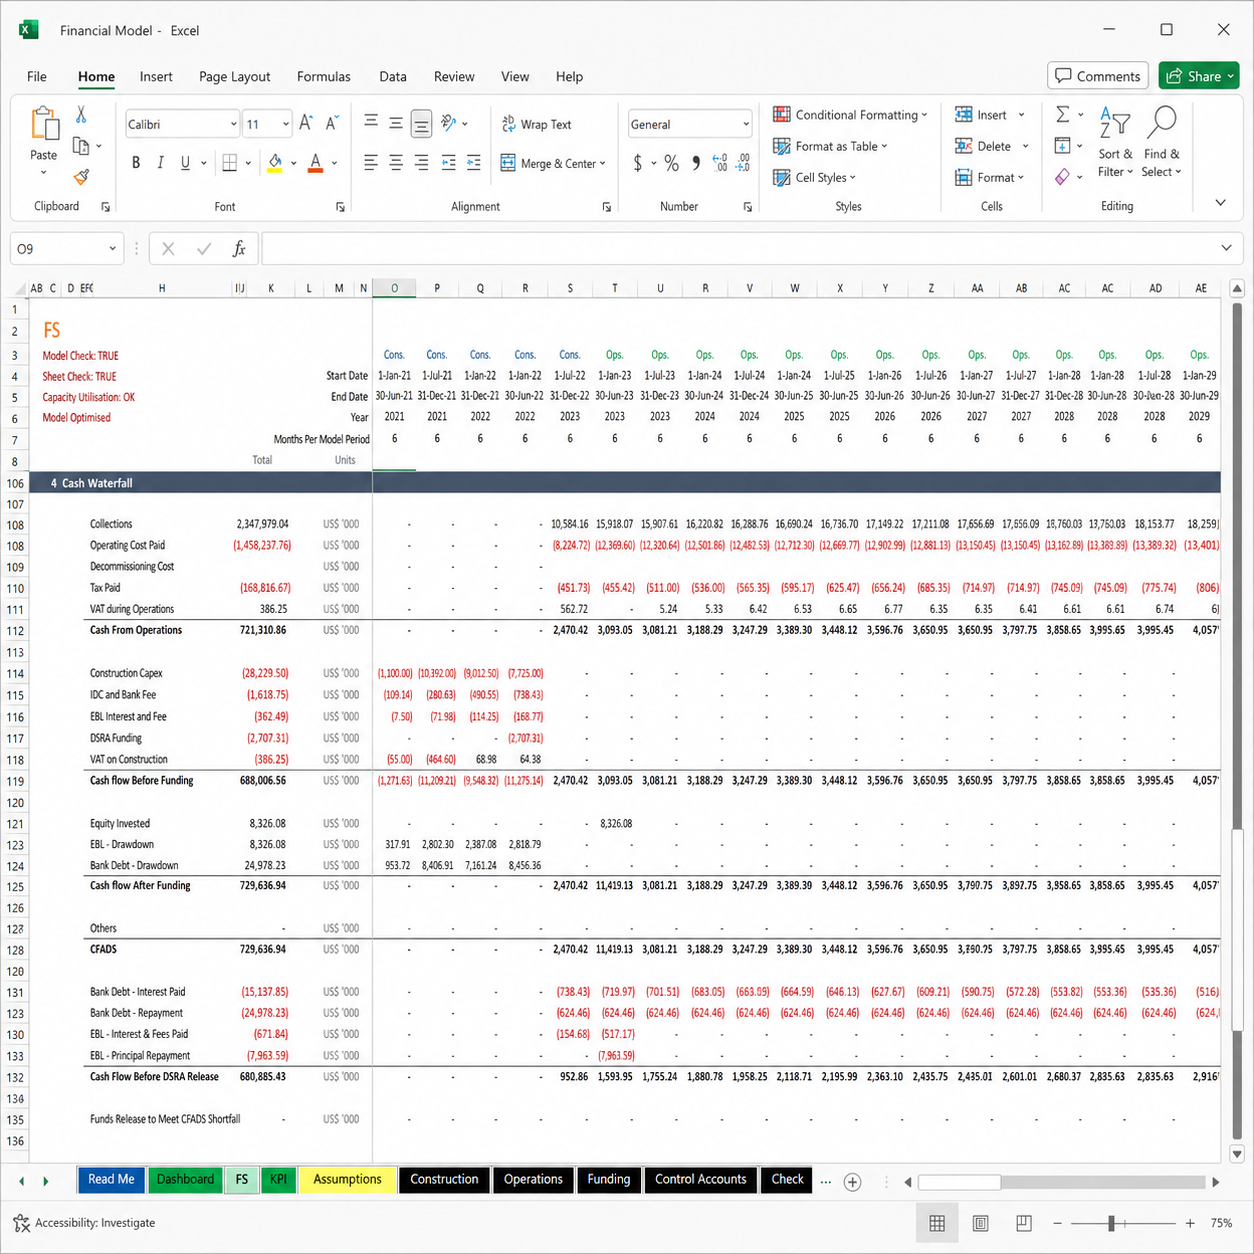
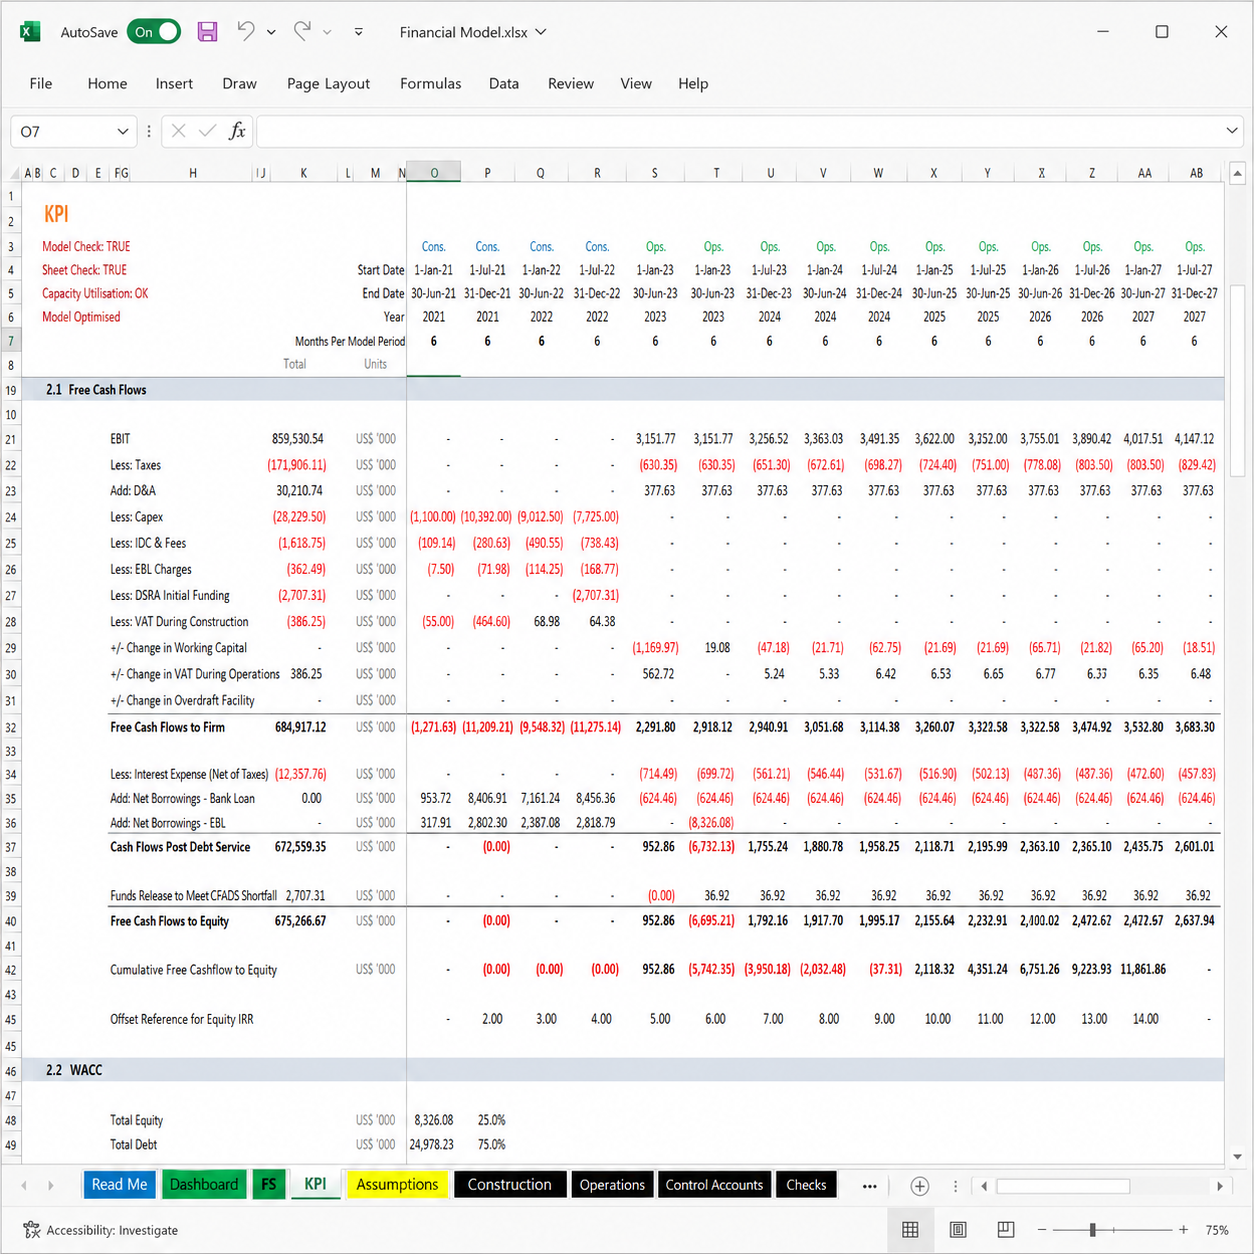
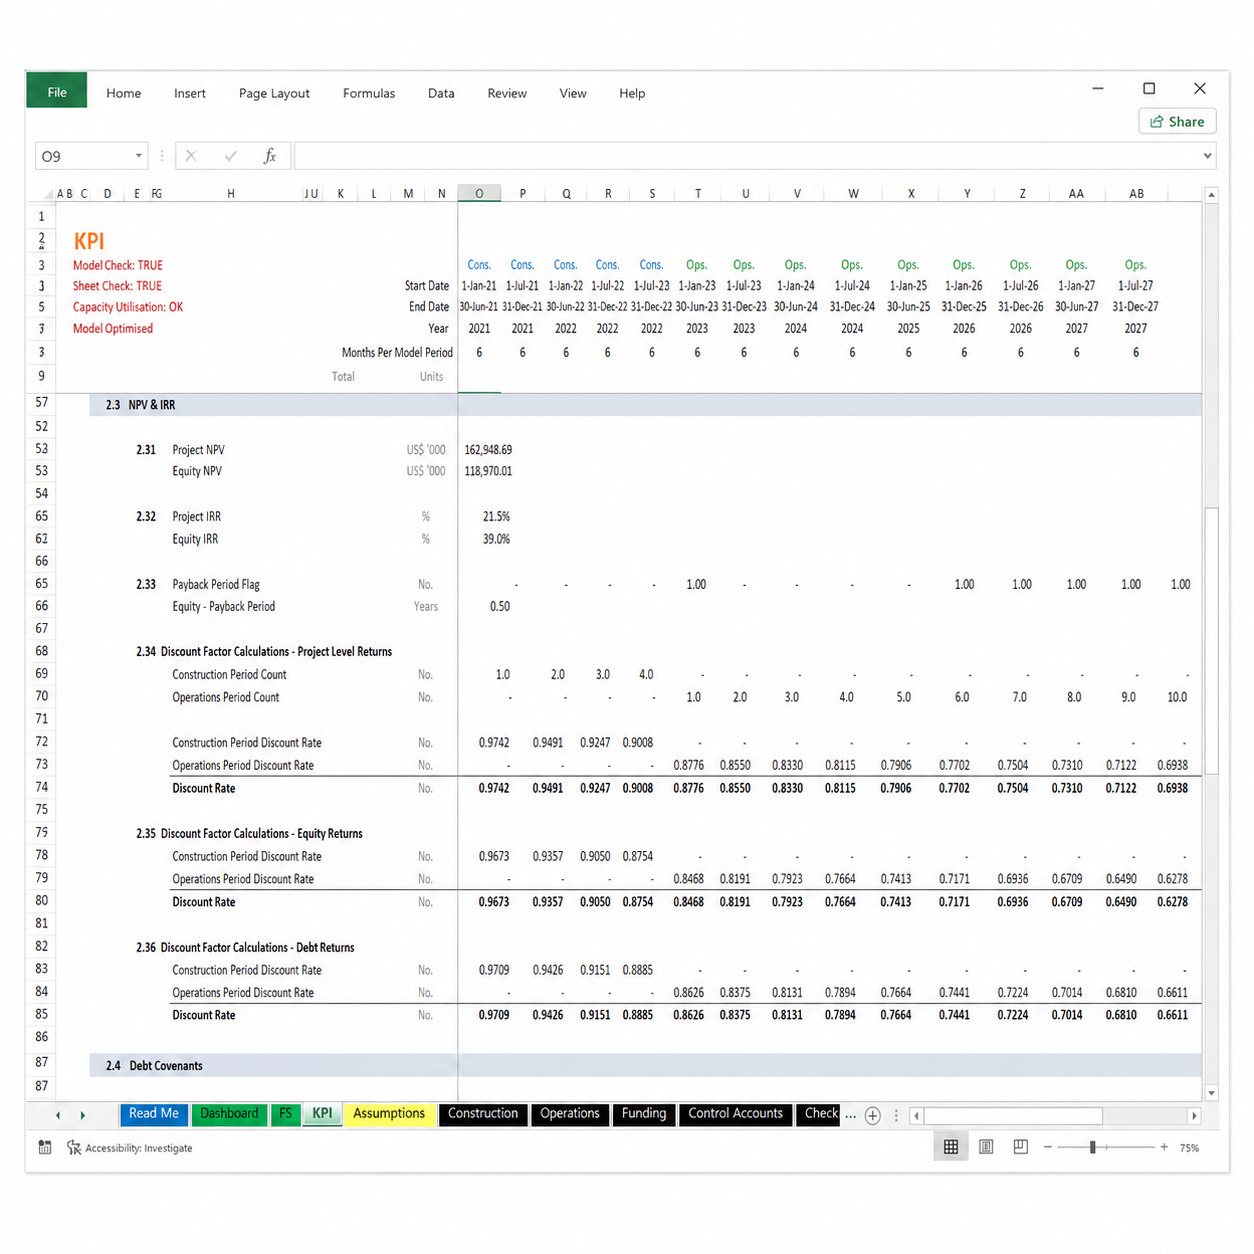
Because it follows project finance convention, the model produces the complete suite of bankability outputs — Project and Equity IRR and NPV, minimum and average DSCR, LLCR, PLCR, equity payback and a full cash waterfall — the numbers that decide whether a project reaches financial close.
Output builds from plant capacity, capacity factor and annual yield across the full probability range — P50, P90 and P99 — adjusted by an irradiation factor, a degradation factor and production seasonality. That probability range is not a detail; it is the language project finance lenders speak.
Lenders do not size debt against a central estimate. They size it against a downside yield they can be confident of exceeding — typically P90, sometimes P99. Having those cases built into the solar PV financial model, rather than approximated, is often the difference between a model a bank will work with and one they send back.
Every driver of viability is an explicit, editable input. The assumptions cover:
| Development & Construction | Development cost, construction cost and developer’s fee |
| Generation Profile | Plant capacity, capacity factor and annual yield (P50, P90, P99), irradiation factor, degradation factor and production seasonality |
| Revenue | PPA term, feed-in tariff (FiT), merchant price and other revenue sources |
| Variable O&M | Cost per unit across eight subheads — staff, electricity, consumables, transport, fuel and more |
| Fixed Costs | SPV cost, insurance, land lease, community payment, management fee and more |
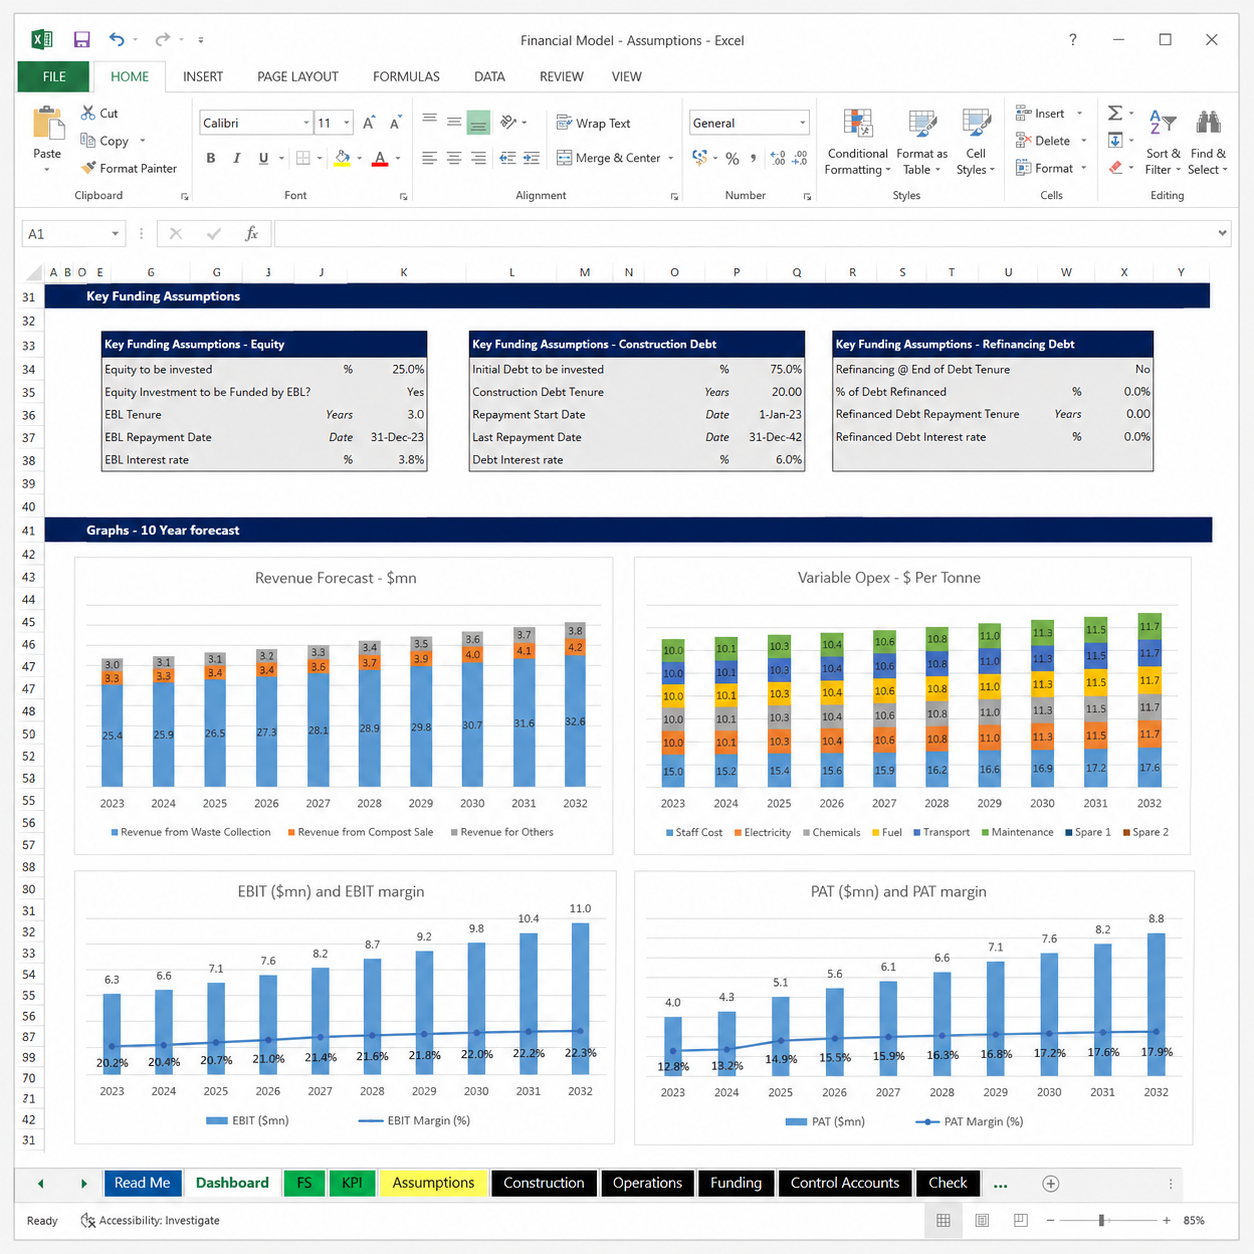
| Funding Profile | Cash equity, bridge loan, bank debt, DSRA and bank overdraft |
| Debt Repayment | Annuity, sculpted and even-principal options |
| Adjustments | Inflation and indexation, VAT during construction and operations, depreciation options and working capital |
This is where the solar PV financial model earns its keep — resolving your assumptions into the full set of metrics a financing decision turns on:
The model separates construction and operation cleanly, and lets you set the length and granularity of each — monthly, quarterly, semi-annual or annual — independently. A precise monthly build can sit alongside an annual operating period, giving detail where it matters without an unwieldy file.
Every revenue and cost assumption can be entered across three scenarios and switched at a button. The debt funding drawdown carries three scenarios of its own — valuable when negotiating terms with financial institutions — and repayment can be profiled as annuity, even-principal or sculpted, each showing its impact on IRR immediately.
The full yield probability range is modelled, so debt can be sized against the downside case lenders actually use.
DSCR, LLCR and PLCR are all calculated, giving lenders the complete coverage picture they require.
Clearly defined input, calculation and output cells, with a colour-coded heat map so even a first-time user can navigate it.
New to these metrics? Read an overview of the debt service coverage ratio. For a model built to your own specification, see our project finance advisory services, or browse the full range of PPP and project finance templates.
P50/P90/P99 yields, a flexible timeline, three scenarios, a full cash waterfall and every lender metric from Project IRR to PLCR — ready in Excel.