$120.00
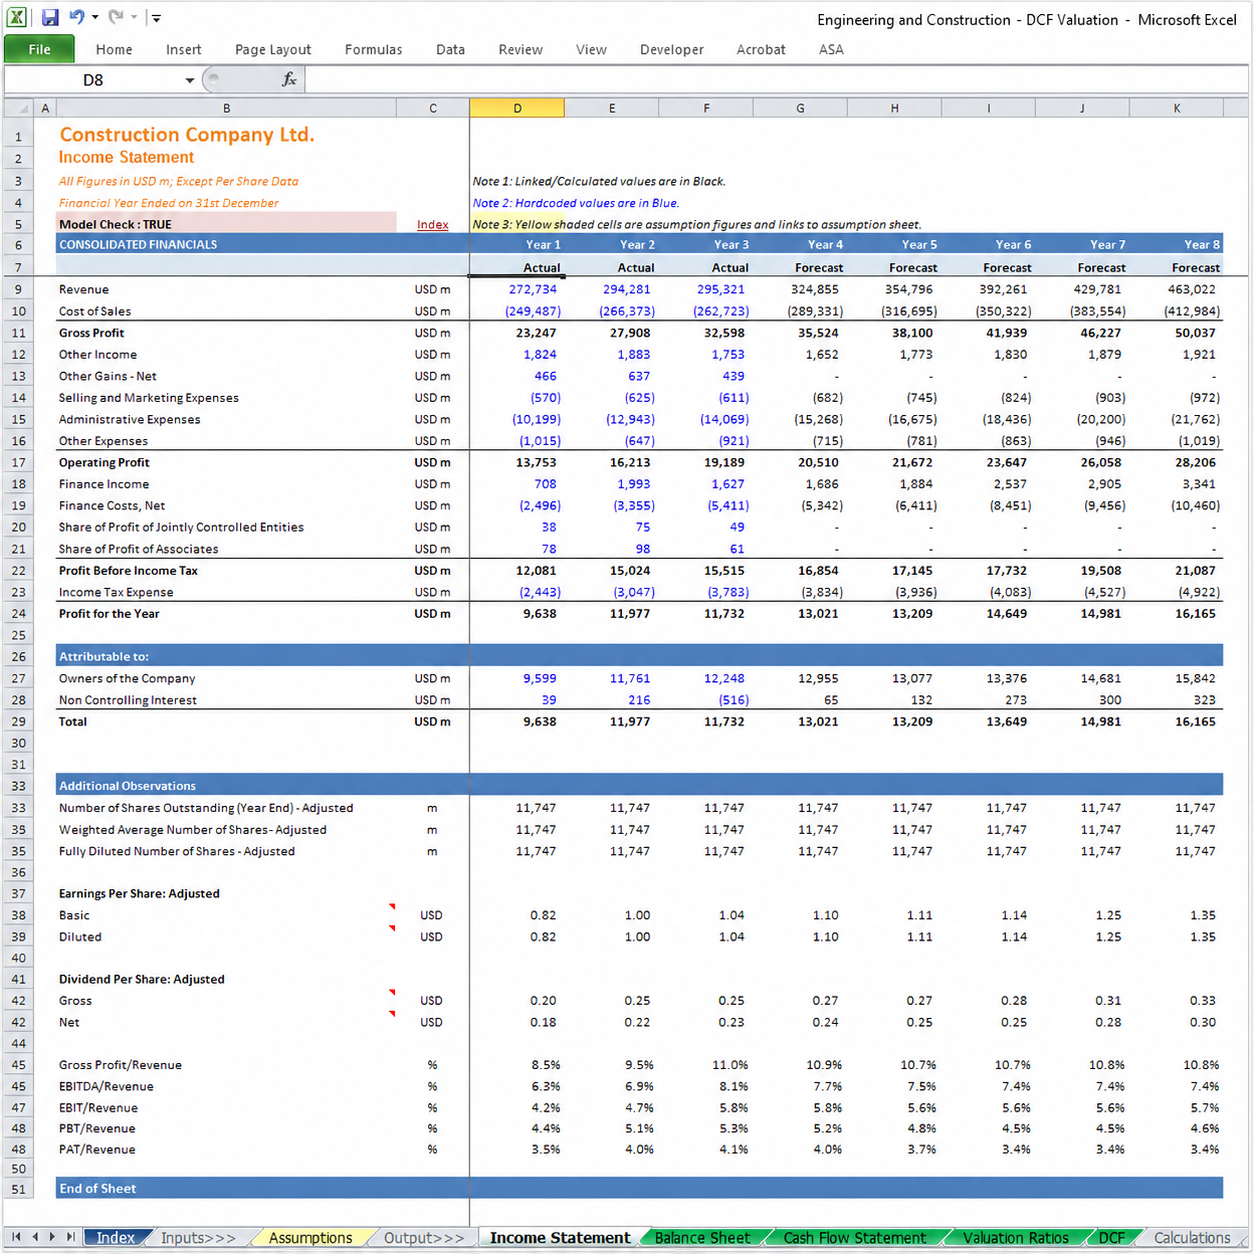
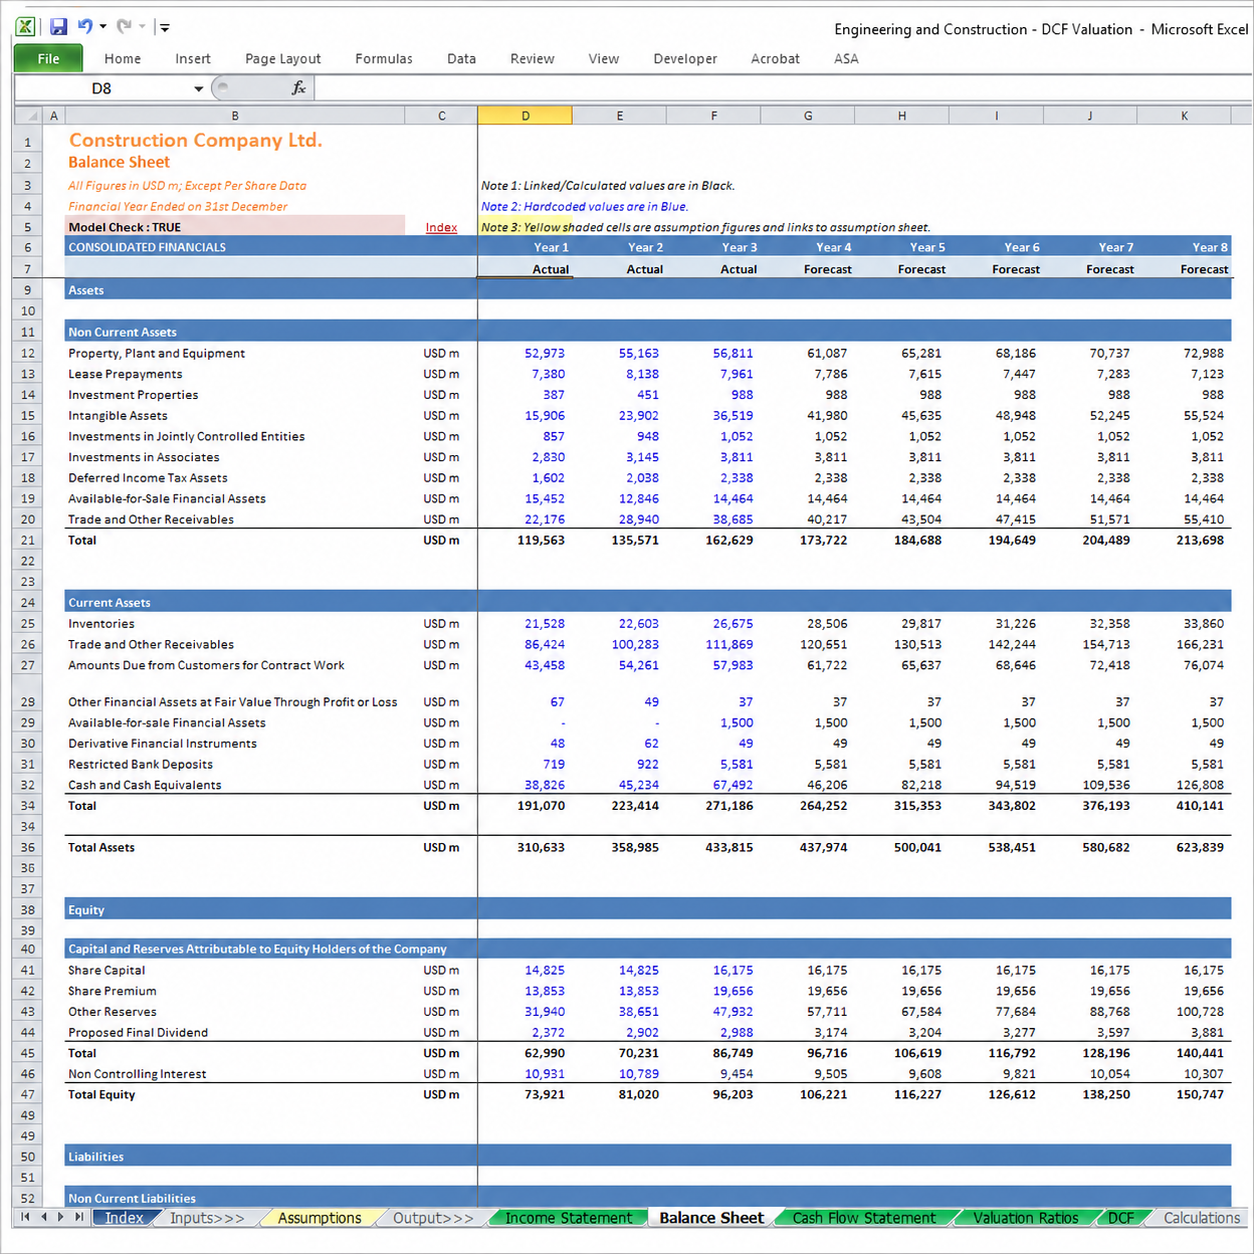
An engineering and construction financial model built for EPC companies, with three integrated financial statements, DCF and comparable company valuation, all in Excel.
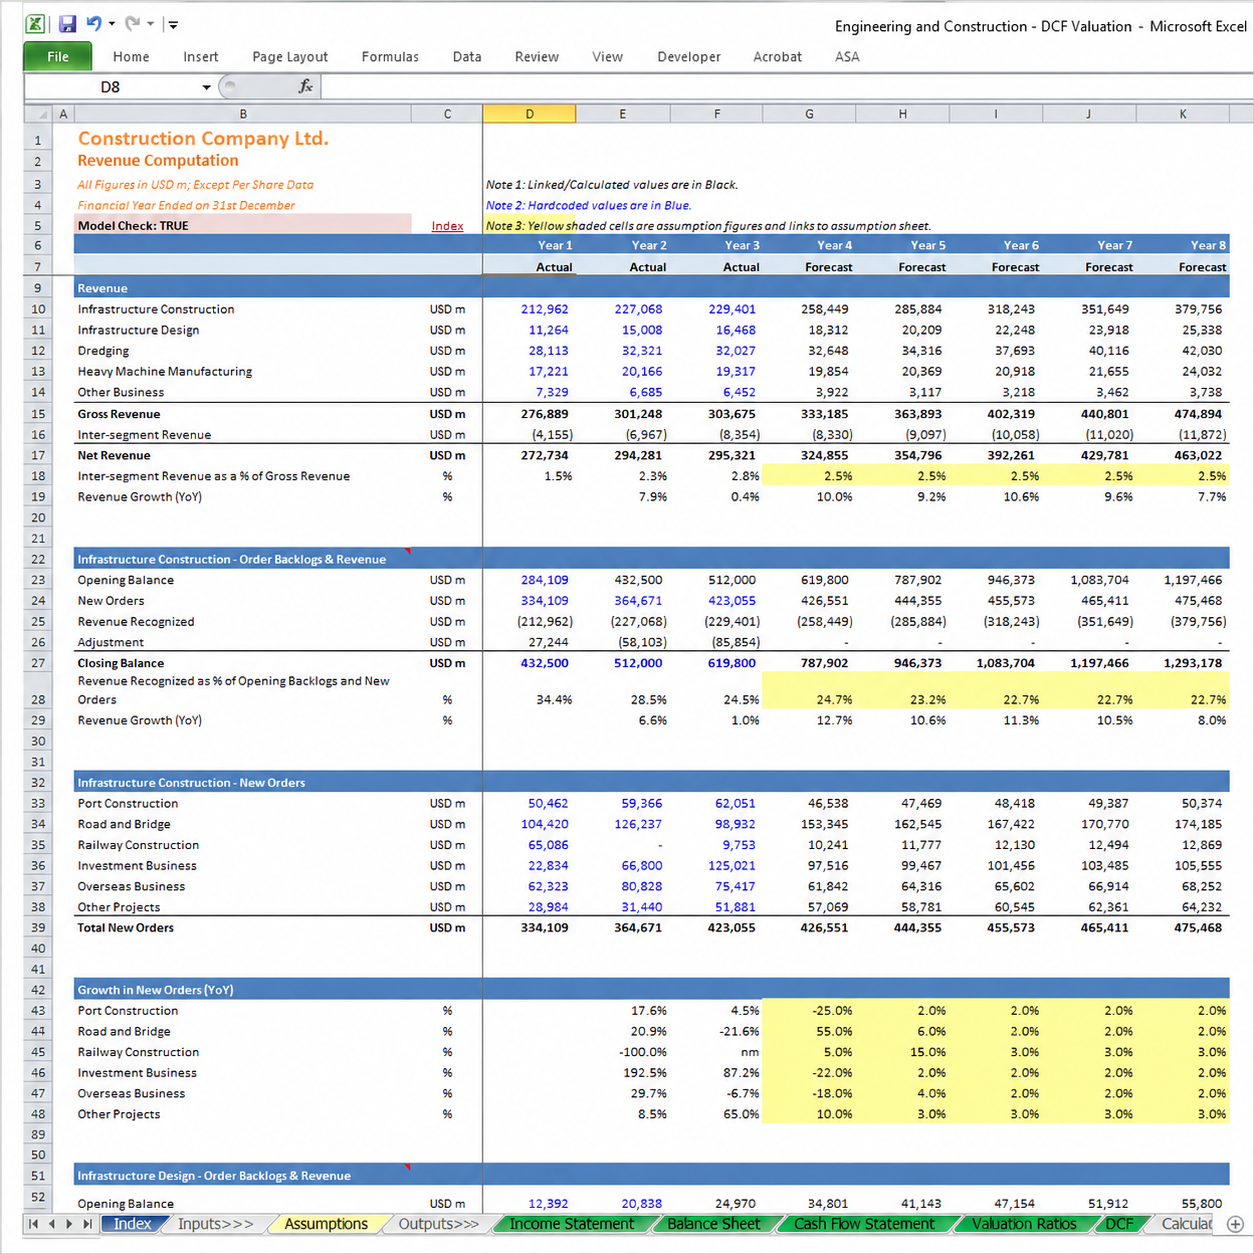
Engineering and construction is a backlog business. Revenue this year was largely won in prior years, and what you win now determines the years ahead. That order-to-revenue pipeline — intake, conversion, backlog — is the real engine of an EPC company, and it is precisely what a generic growth-rate model cannot represent. Value an EPC firm without modelling its order book and you are guessing.
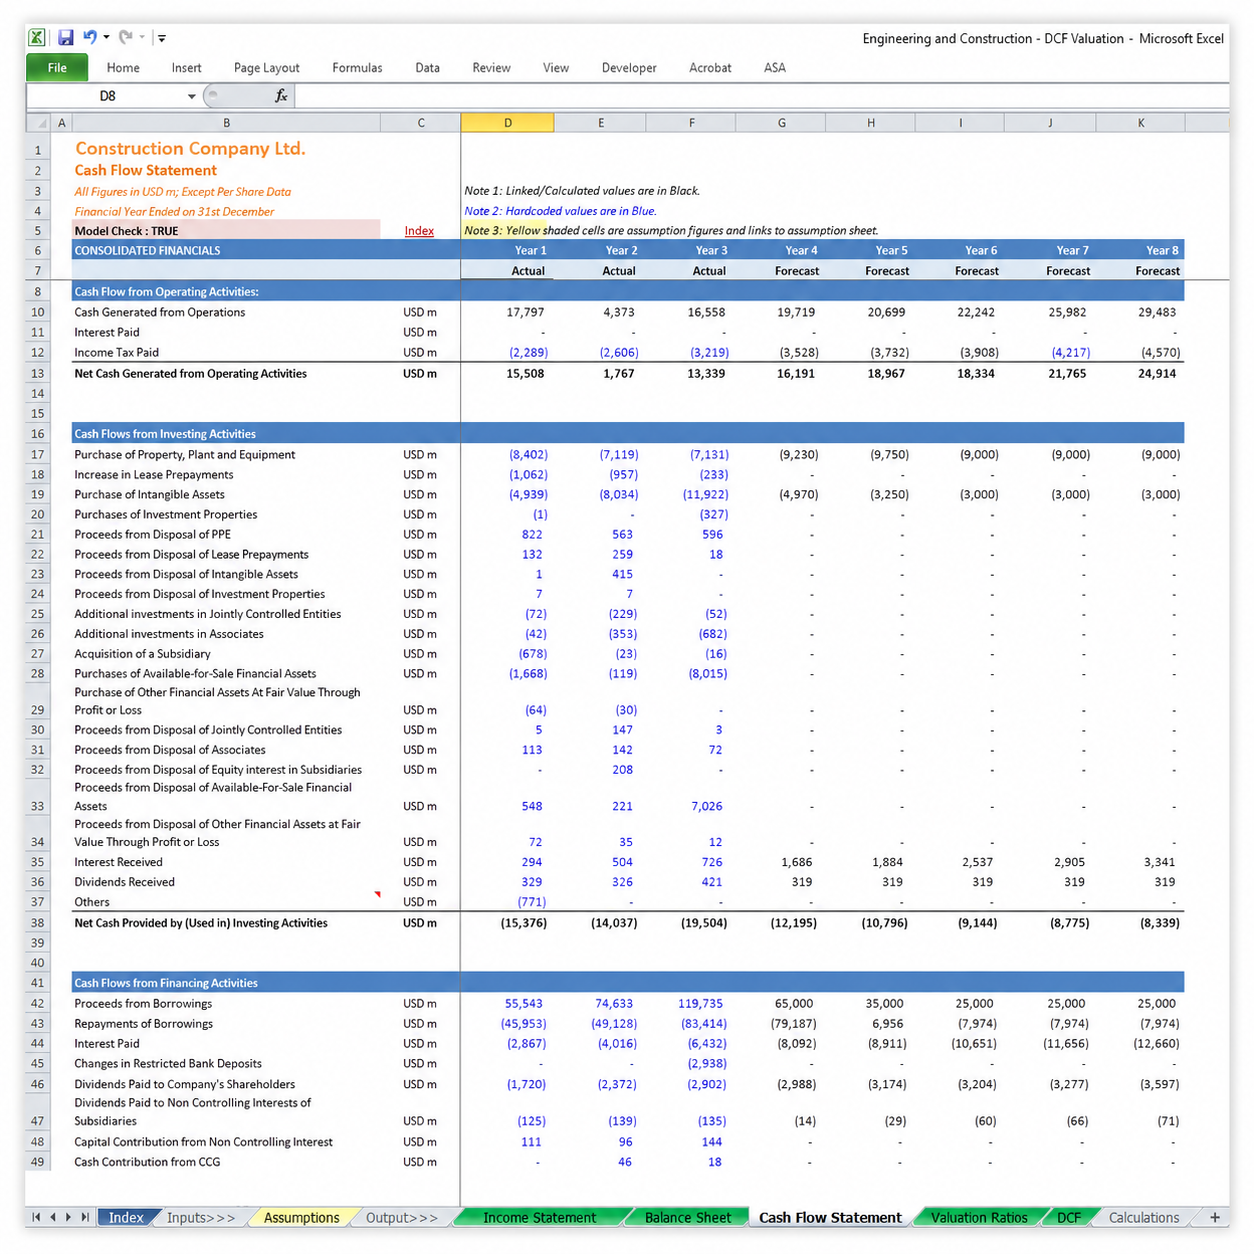
This model builds revenue from order intake, order conversion and backlog, so the pipeline drives the forecast the way it drives the actual business. Costs separate raw material from subcontracting — the two levers that decide EPC margins — and working capital gets full treatment, which matters enormously in a sector where projects tie up cash for years before they pay out.
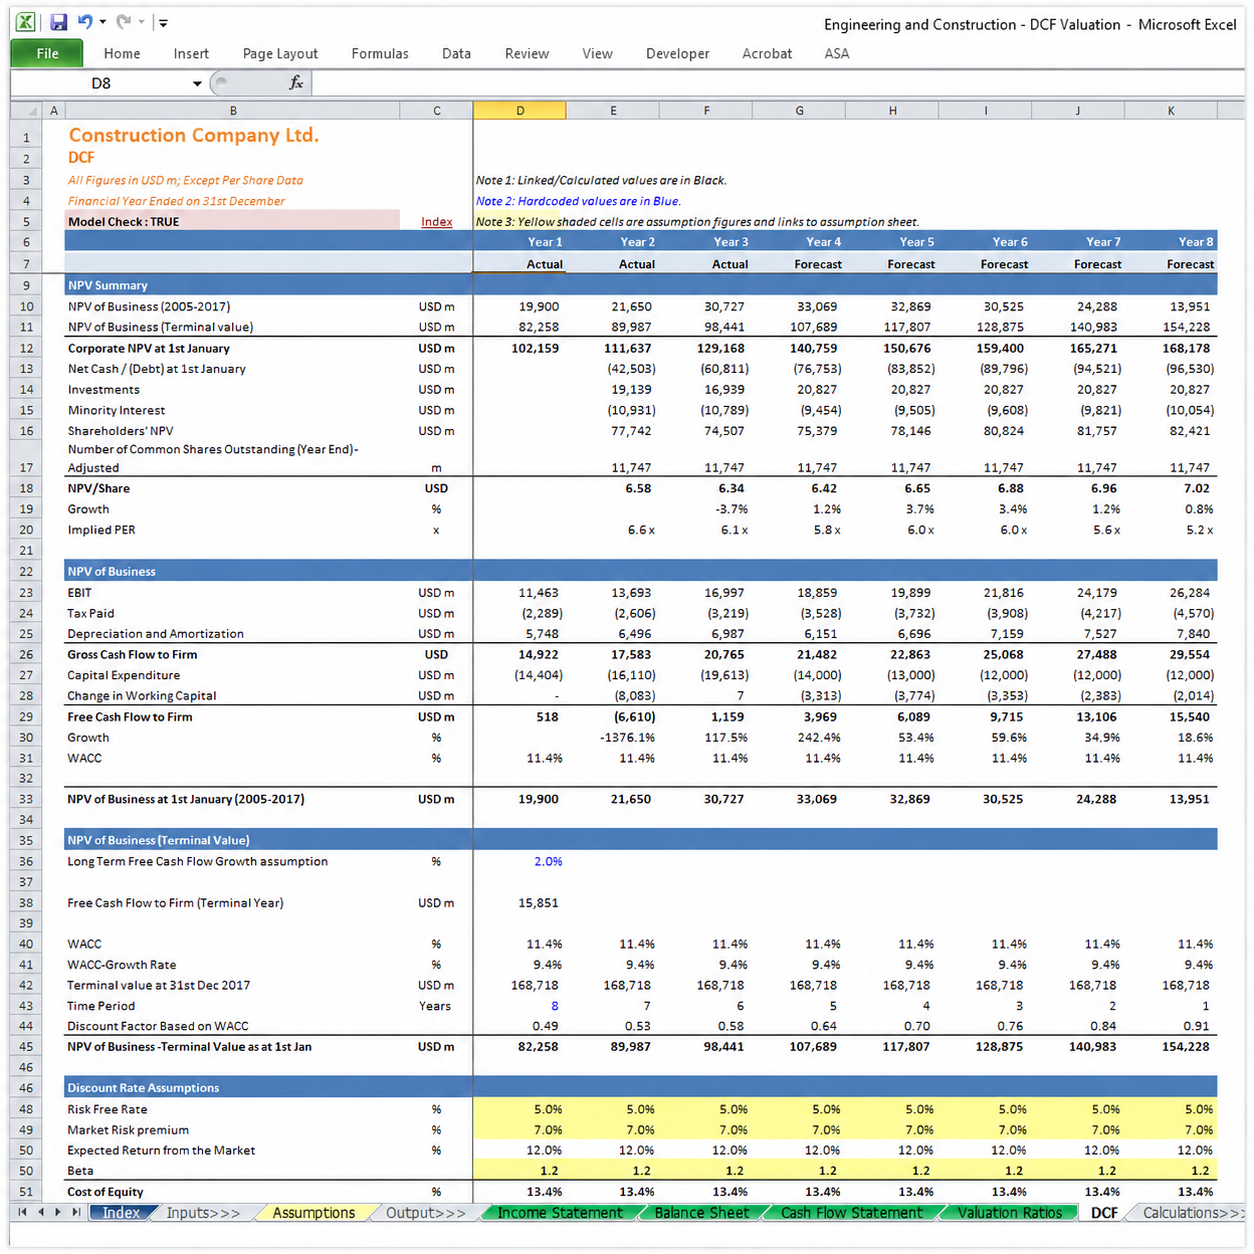
The model covers 3 years of historical data plus a 5-year forecast period. Valuation uses both discounted cash flow methodology and Comparable Company Analysis, so you can triangulate rather than rely on a single approach.
A DCF captures the intrinsic value of the forecast cash flows. Comparable company analysis anchors that against how the market is actually pricing peers. Used together, they give you a range rather than a single number — and a defensible answer when someone challenges either method in isolation.
This is especially useful in construction, where cyclicality and order-book visibility can pull intrinsic and relative valuations apart. Seeing both side by side tells you something the individual numbers cannot.
A single assumption sheet drives the entire model. Change an input and every statement, ratio and valuation output updates automatically. The inputs cover:
| Revenue | Order intake, order conversion and backlog |
| Costs | Raw material, subcontracting cost and other operating expenses |
| Income Tax | Effective and statutory tax treatment |
| Working Capital | Receivables, payables and inventory |
| Capex & Depreciation | Tangible and intangible assets, with full amortisation schedules |
| Debt | Long-term and short-term borrowings |
| Share Capital | Issue of new shares and reserve accounts |
| Dividends | Interim and final dividend, including tax impact |
| Interest | Interest income and interest expense calculations |
Comprehensive calculations run off your inputs to generate a complete set of outputs:
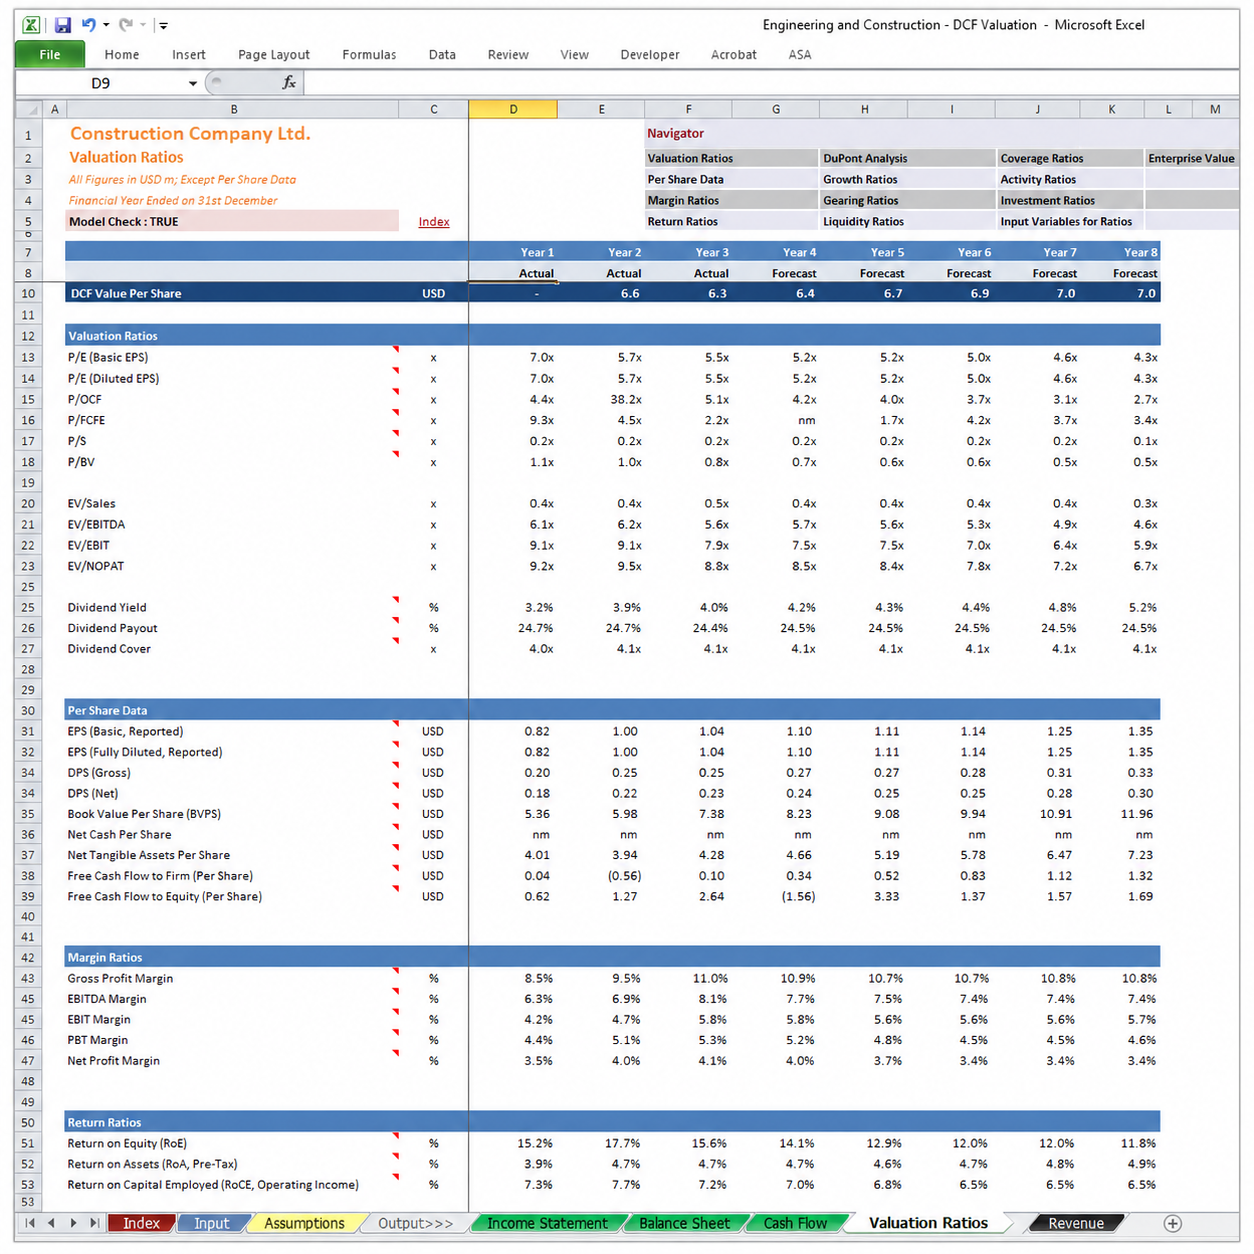
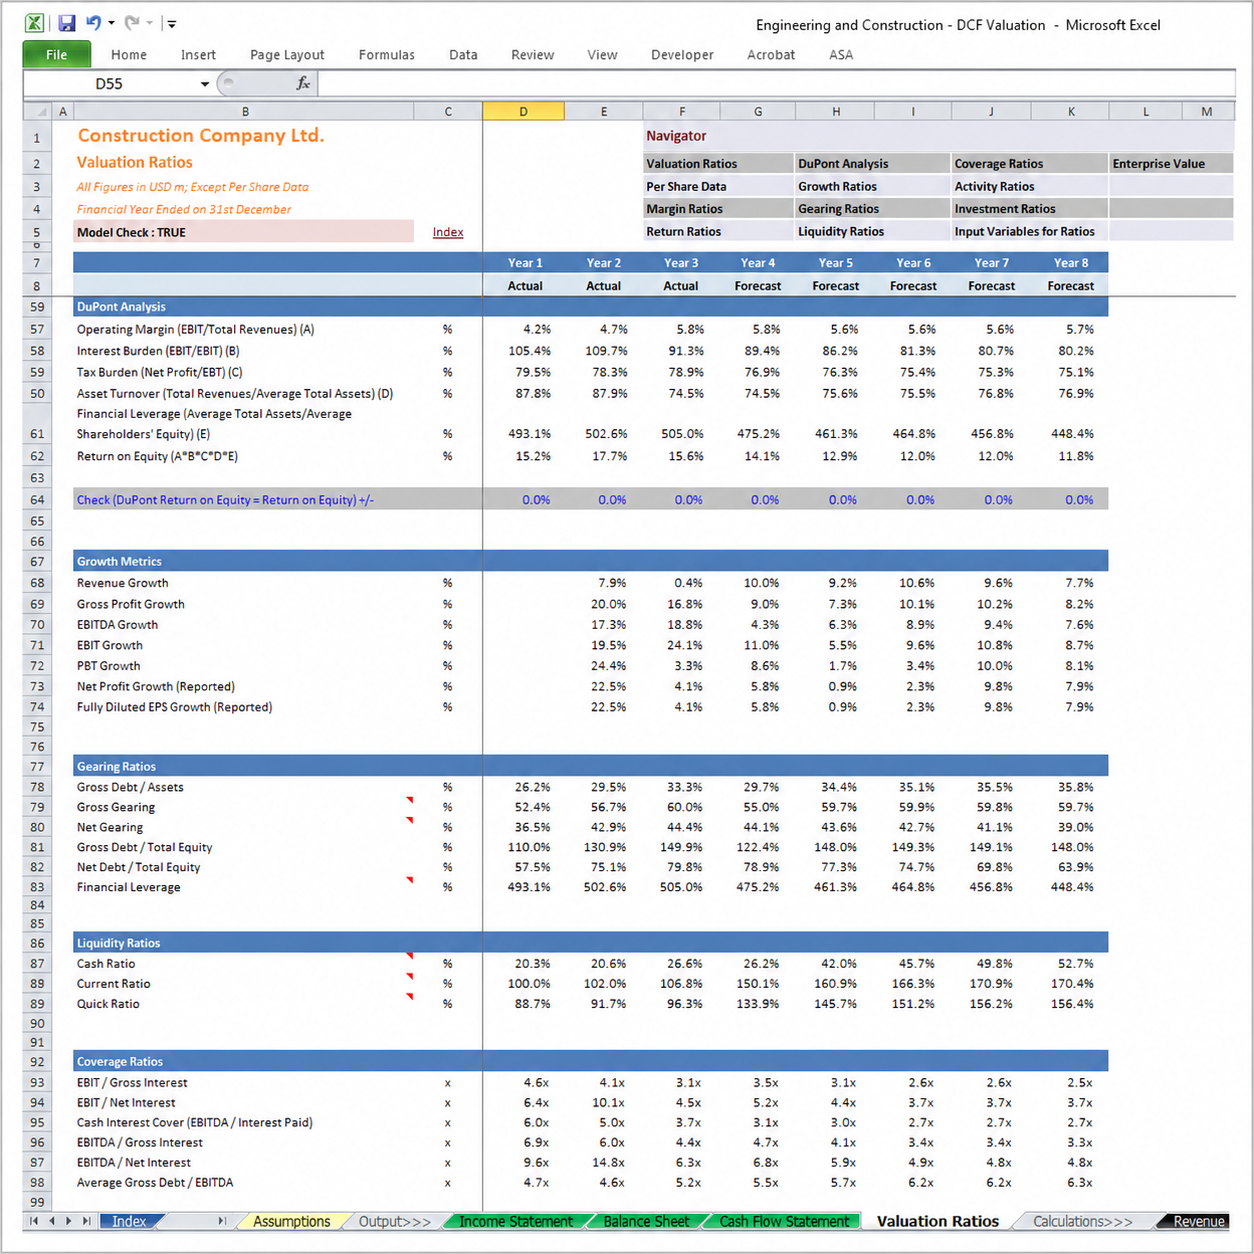
The analysis sheet goes considerably beyond a standard ratio summary, giving you the metrics an analyst would expect in a full valuation pack:
Price and EV-based valuation ratios, enterprise value, plus per-share data including EPS, DPS and FCFF per share.
Margin ratios, return ratios and a full DuPont decomposition of ROE into its operating, efficiency and leverage components.
Gearing ratios, liquidity ratios and coverage ratios — critical for a working-capital-heavy sector.
Activity ratios covering asset and working capital efficiency, plus investment ratios for shareholder analysis.
Intake, conversion and backlog build the forecast, reflecting how an EPC business actually earns rather than a generic growth line.
Two valuation methods in one model, so you can present a defensible range rather than a single point estimate.
Every formula is visible and traceable. Audit the logic, adapt it to your own business, or use it to see how a proper DCF is constructed.
Need a model built to your own specification? See our financial advisory services, or browse the full range of DCF valuation templates.
Order-book driven revenue, three years of history, a five-year forecast, DCF and comparable company valuation, and a complete ratio pack.