$149.00
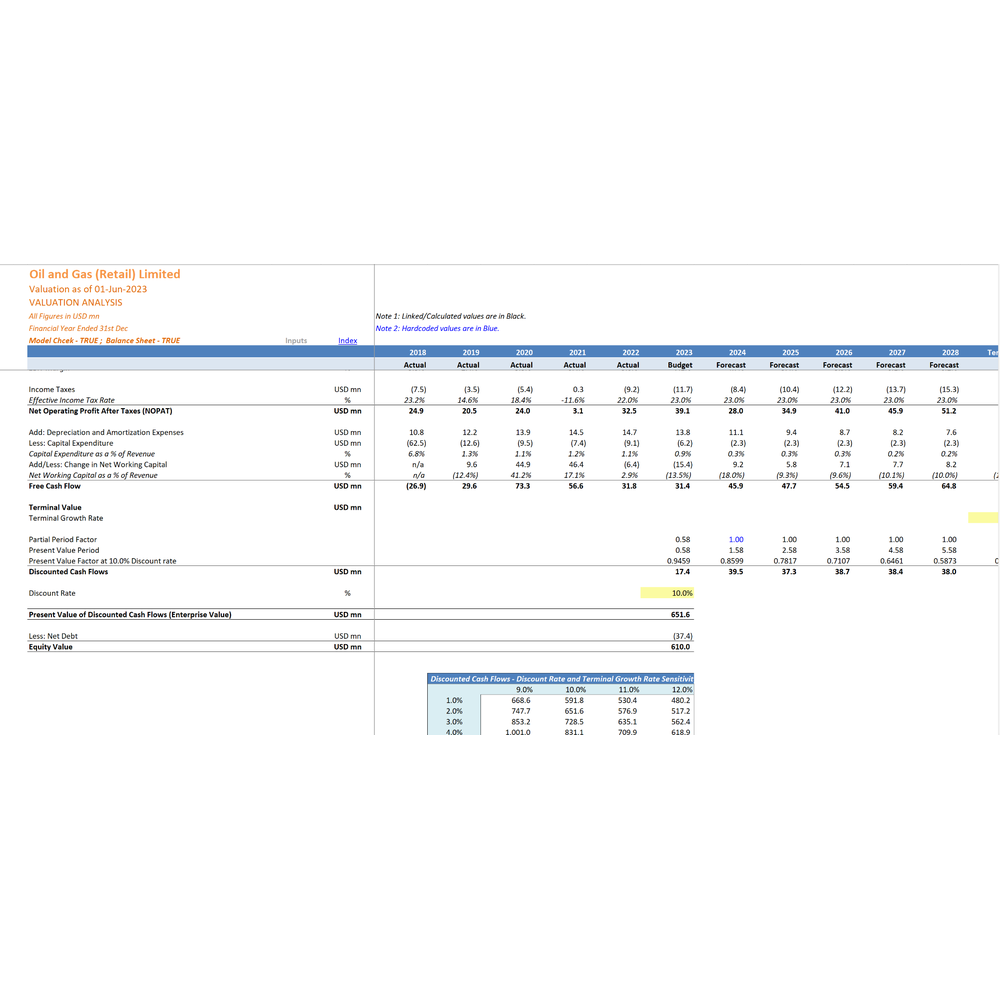
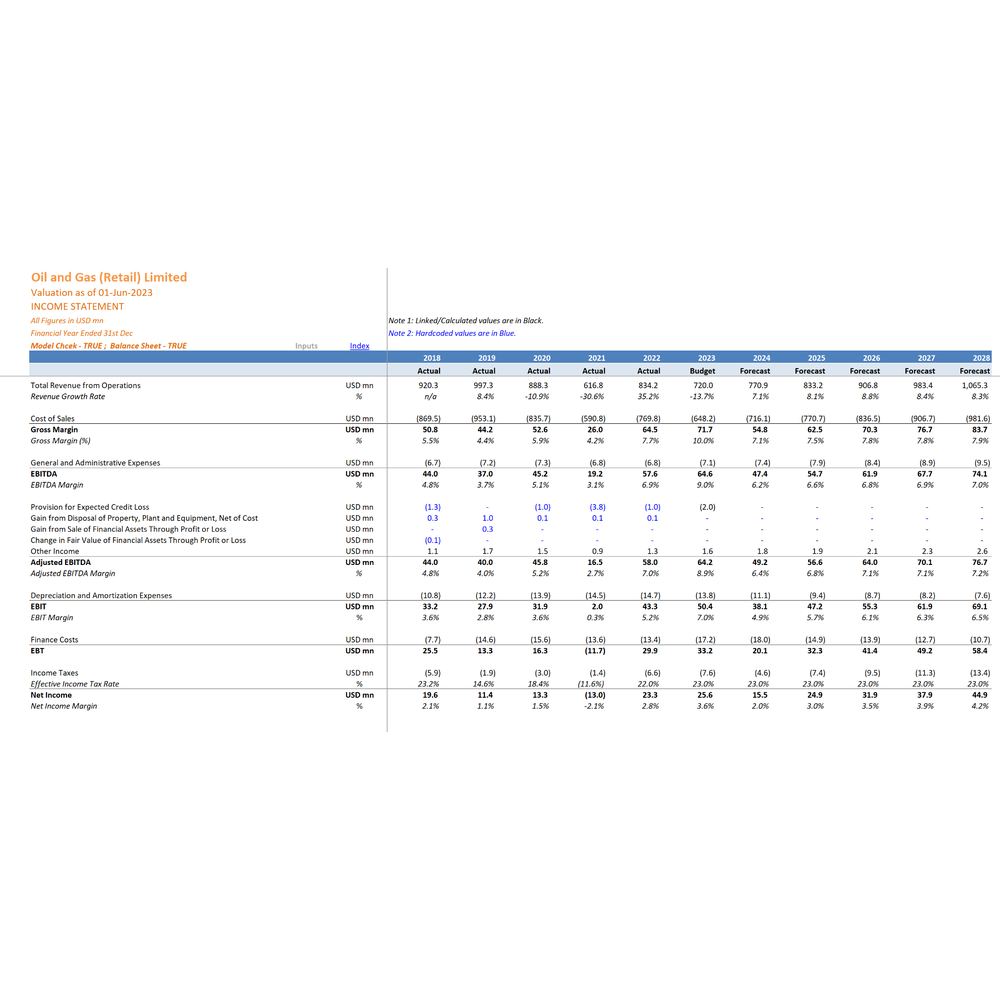
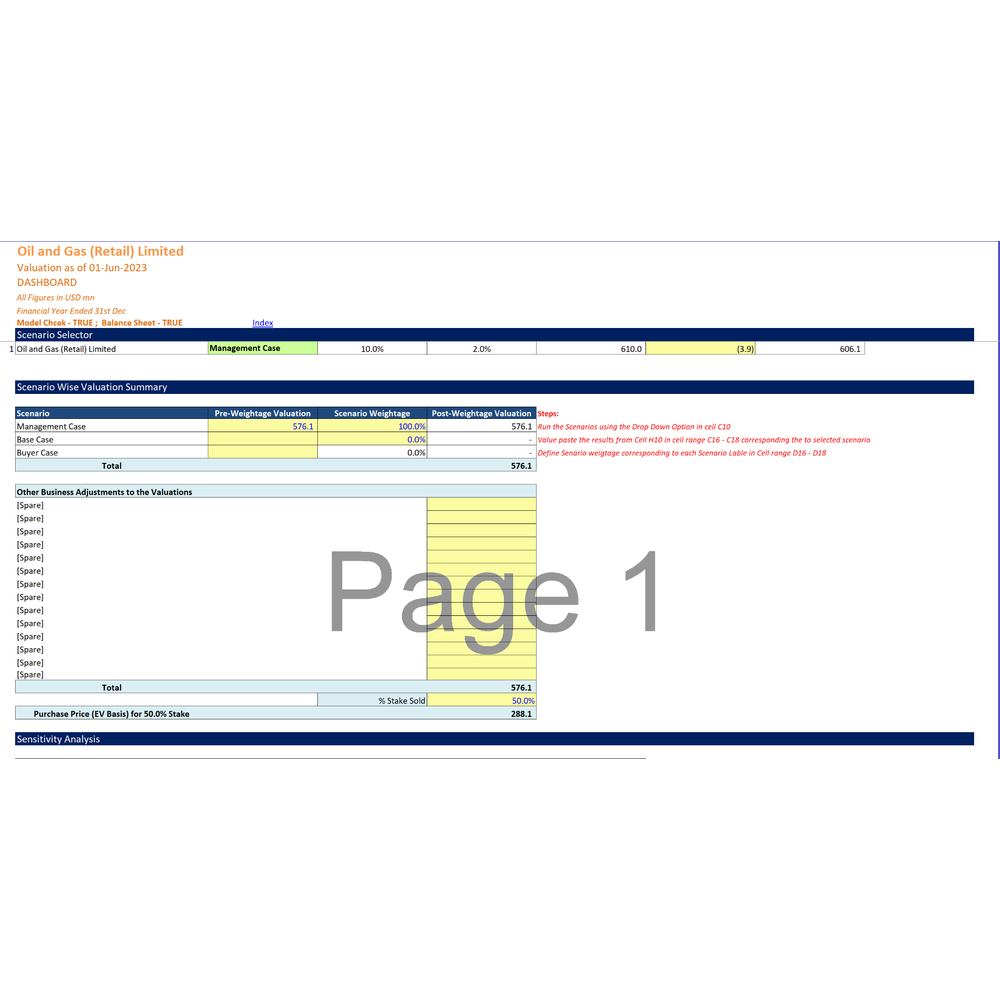
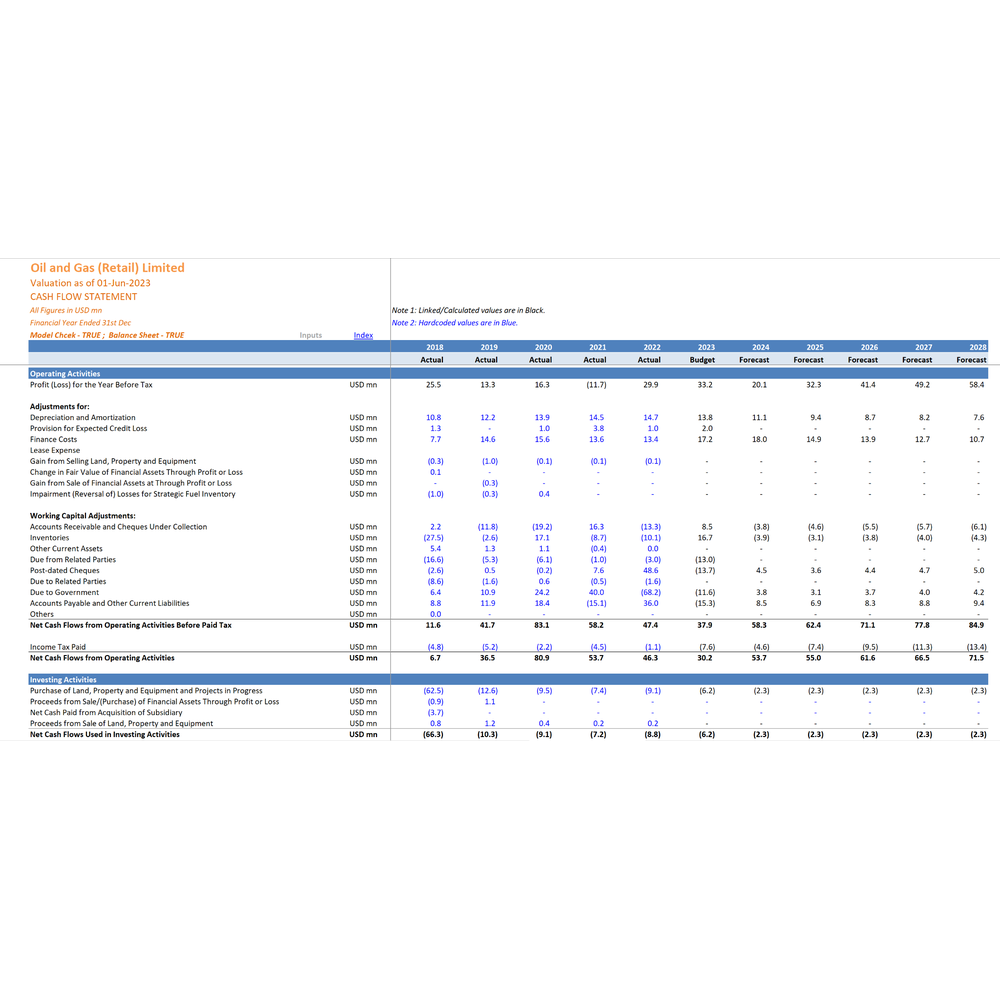
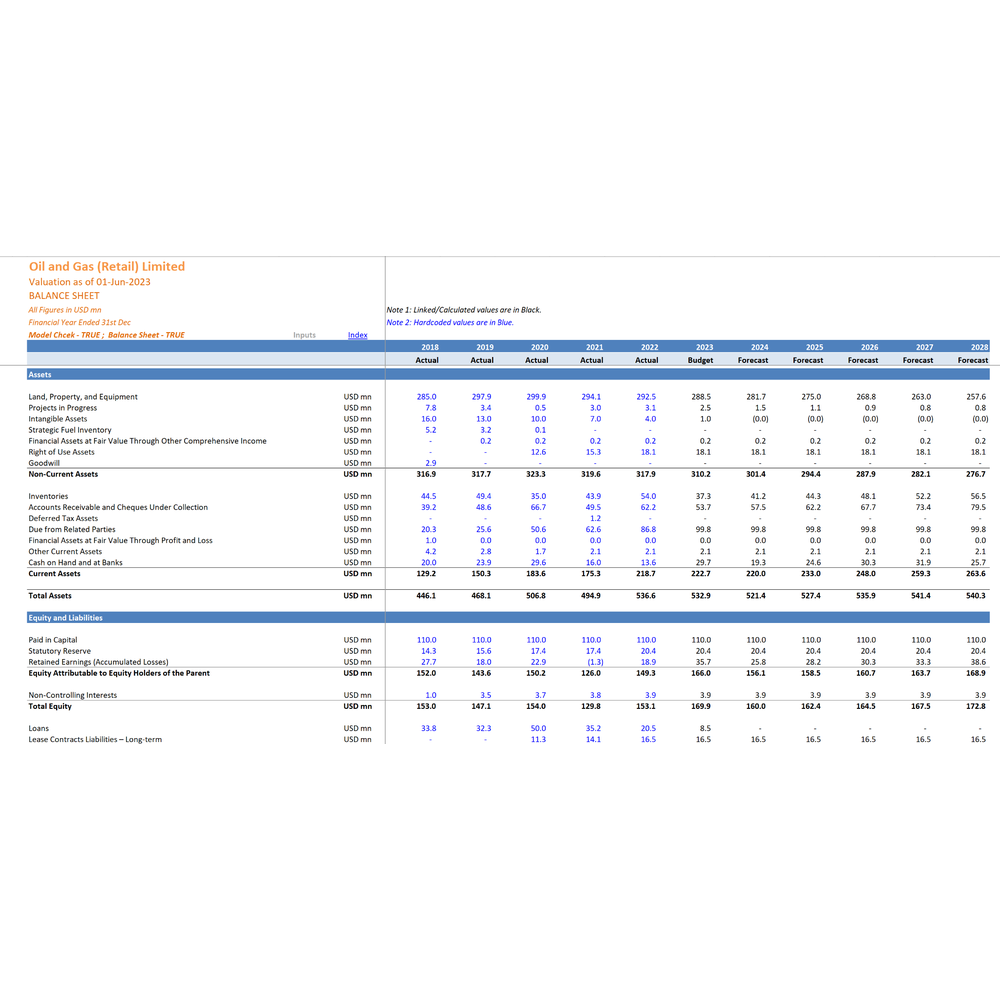
An oil and gas marketing financial model for a fuel marketing and distribution business, with three integrated financial statements and full DCF-based valuation, built entirely in Excel.
Fuel marketing and distribution is a network business. Value does not come from a single asset but from a fleet of stations, each throwing off volume across petrol, diesel and kerosene, supplemented by transportation, rental and grocery income. Ownership structure matters too — a company-owned, company-operated site earns differently from a dealer-owned, dealer-operated one. A generic revenue-growth model captures none of this, which is precisely why fuel retailers are so often mis-valued.
This model is built from the station up. Business drivers begin with the number of stations, split by CoCo and DoDo, and sales volume by product. Revenue then layers fuel and oil sales, fuel transportation, rental, grocery and export on top. The result is a forecast that reflects how a distribution network actually earns — station by station, product by product.
The model covers 5 years of historical data, a 1-year budget, and a 5-year forecast period — the fullest timeline in the range. The dedicated budget year bridges actuals and forecast, so you can anchor projections to a formal plan rather than jumping straight from history to long-range assumptions.
Because volumes are modelled by product and by station type, you can answer the questions that actually matter to a fuel retailer. What happens to value if the network expands by twenty CoCo sites? If diesel volume shifts toward petrol? If non-fuel income from grocery and rental grows as a share of the mix? Each of these is a lever you can pull, not an assumption buried in a single growth rate.
Capital expenditure is modelled by asset class — land, building, vehicles, machinery and tools, computer and systems — rather than as one lump. For a network that is continually building, refurbishing and re-equipping sites, that granularity gives the depreciation schedule and the free cash flow a firmer footing.
A single assumptions area drives the entire model. Change an input and every statement, ratio and valuation output updates automatically. The inputs cover:
| Business Drivers | Number of stations (CoCo and DoDo), sales volume by product — petrol, diesel, kerosene |
| Revenue | Fuel and oil revenue, fuel transportation, rental, grocery and export |
| Costs | Fuel cost, SG&A and other overheads |
| Capex & Depreciation | By asset class — land, building, vehicles, machinery and tools, computer and systems |
| Working Capital | Receivables, payables and inventory |
| Debt | Long-term and short-term bank debt, bank overdraft |
| Share Capital | Issue of new shares and reserve accounts |
| Dividends | Dividend payout with tax impact |
| Interest & Tax | Interest income and expense, and income tax |
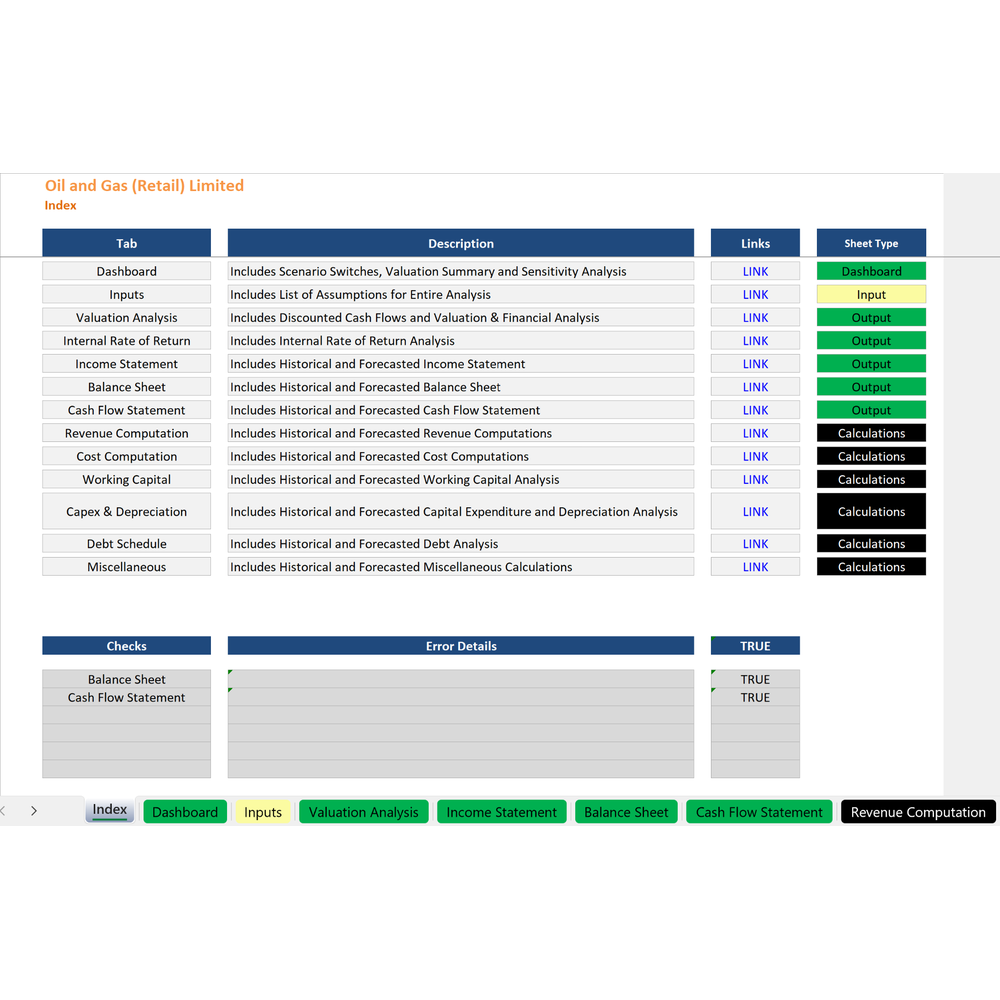
Comprehensive calculations run off your inputs to generate a complete set of outputs:
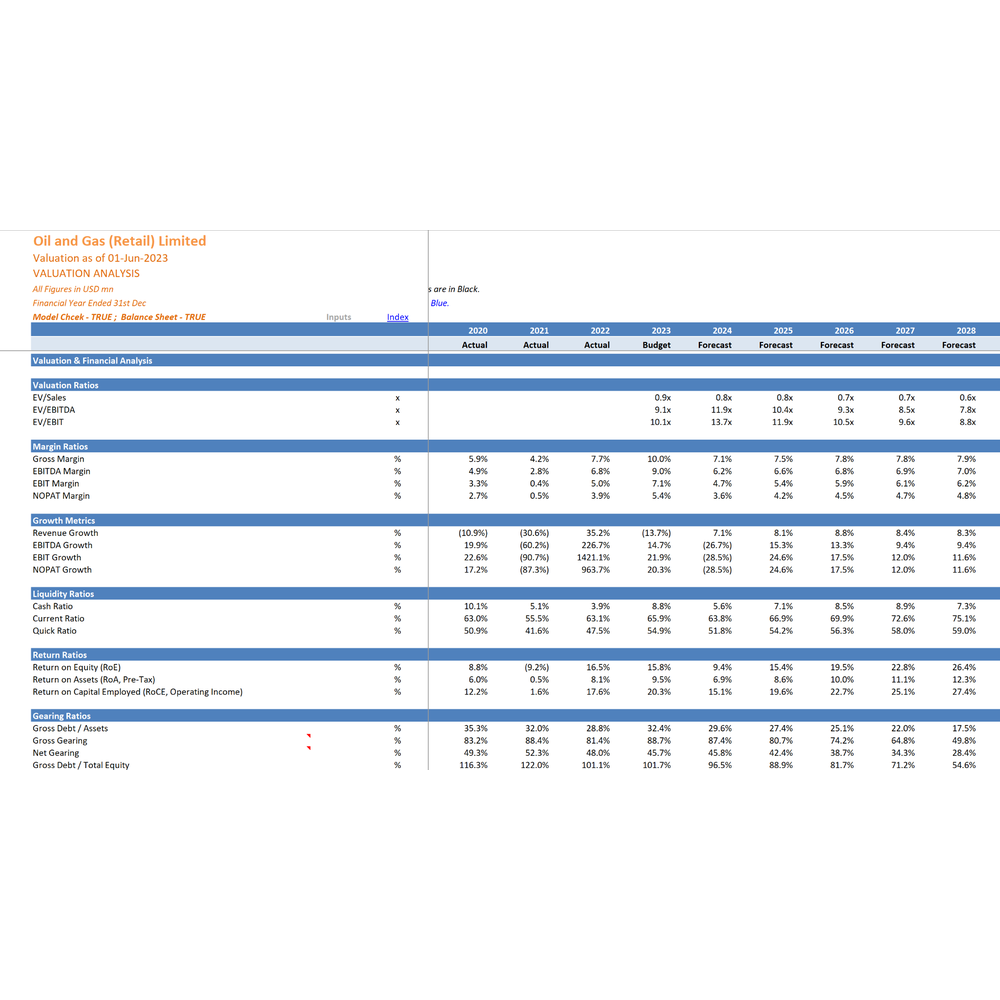
The analysis sheet goes considerably beyond a standard ratio summary, giving you the metrics an analyst would expect in a full valuation pack:
Price and EV-based valuation ratios, enterprise value, plus per-share data including EPS, DPS and FCFF per share.
Margin ratios, return ratios and a full DuPont decomposition of ROE into its operating, efficiency and leverage components.
Gearing ratios, liquidity ratios and coverage ratios — important for a working-capital-intensive distribution business.
Activity ratios covering asset and working capital efficiency, plus investment ratios for shareholder analysis.
CoCo and DoDo station counts and product volumes build the forecast, reflecting how a fuel network actually earns.
Five actuals, a formal budget year, then five forecast years — a fuller timeline that bridges plan and projection.
Land, building, vehicles, machinery and systems modelled separately, for a firmer depreciation and cash flow view.
Need a model built to your own specification? See our financial advisory services, or browse the full range of DCF valuation templates.
Station-level drivers, five years of actuals, a budget year, a five-year forecast, DCF valuation and a complete ratio pack.