$149.00
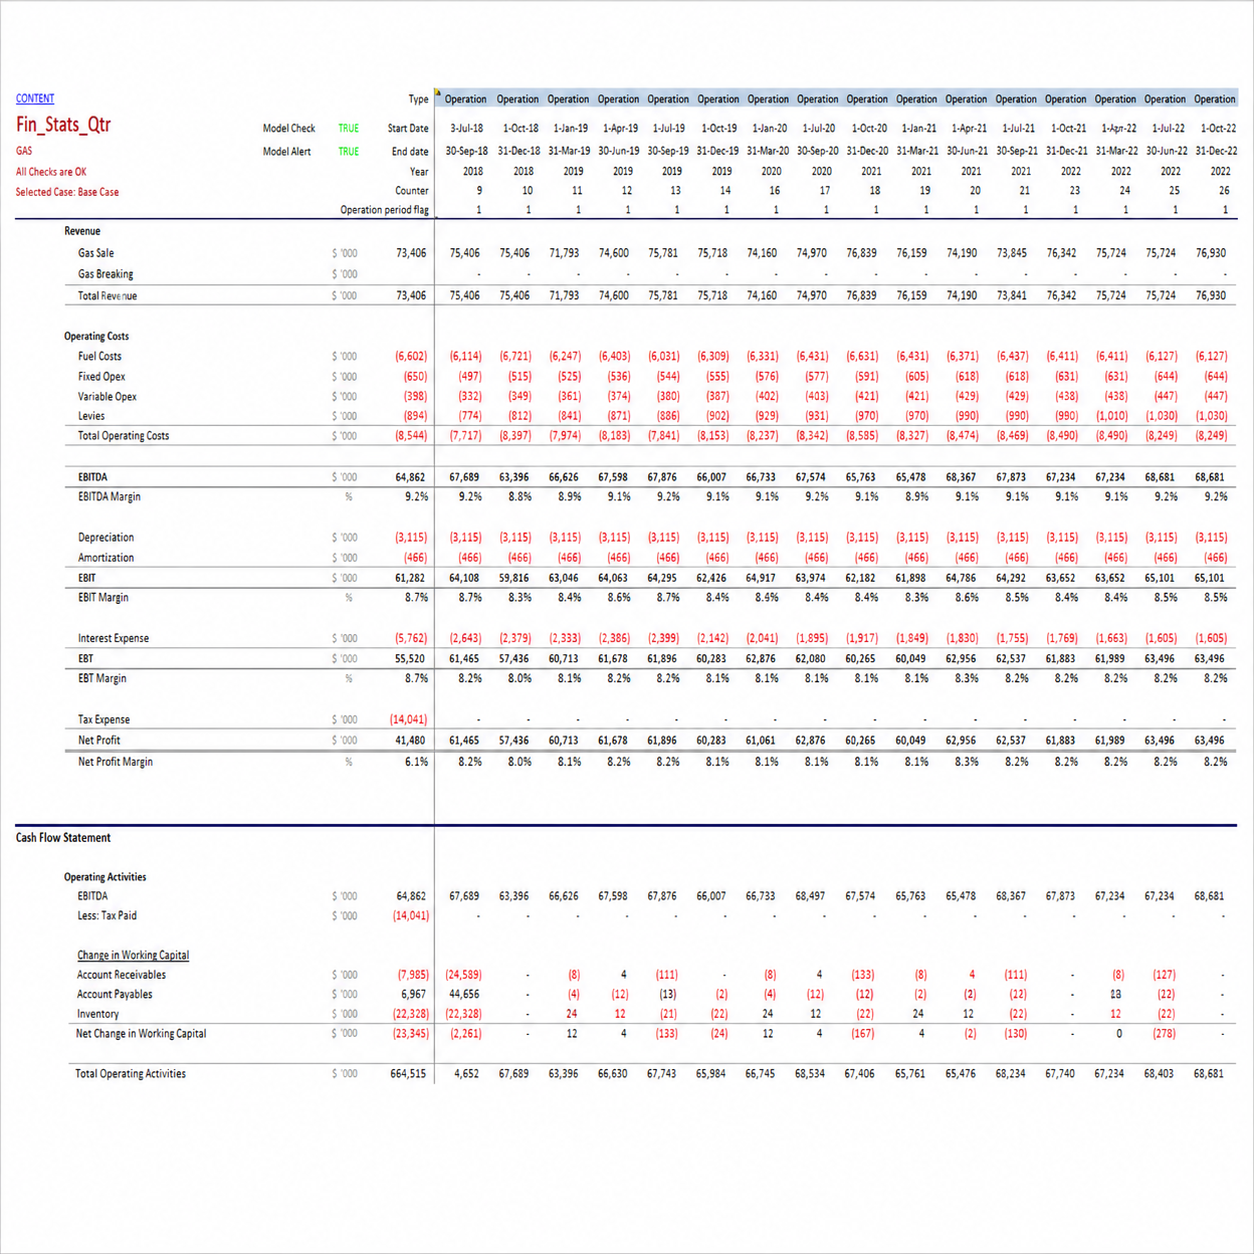
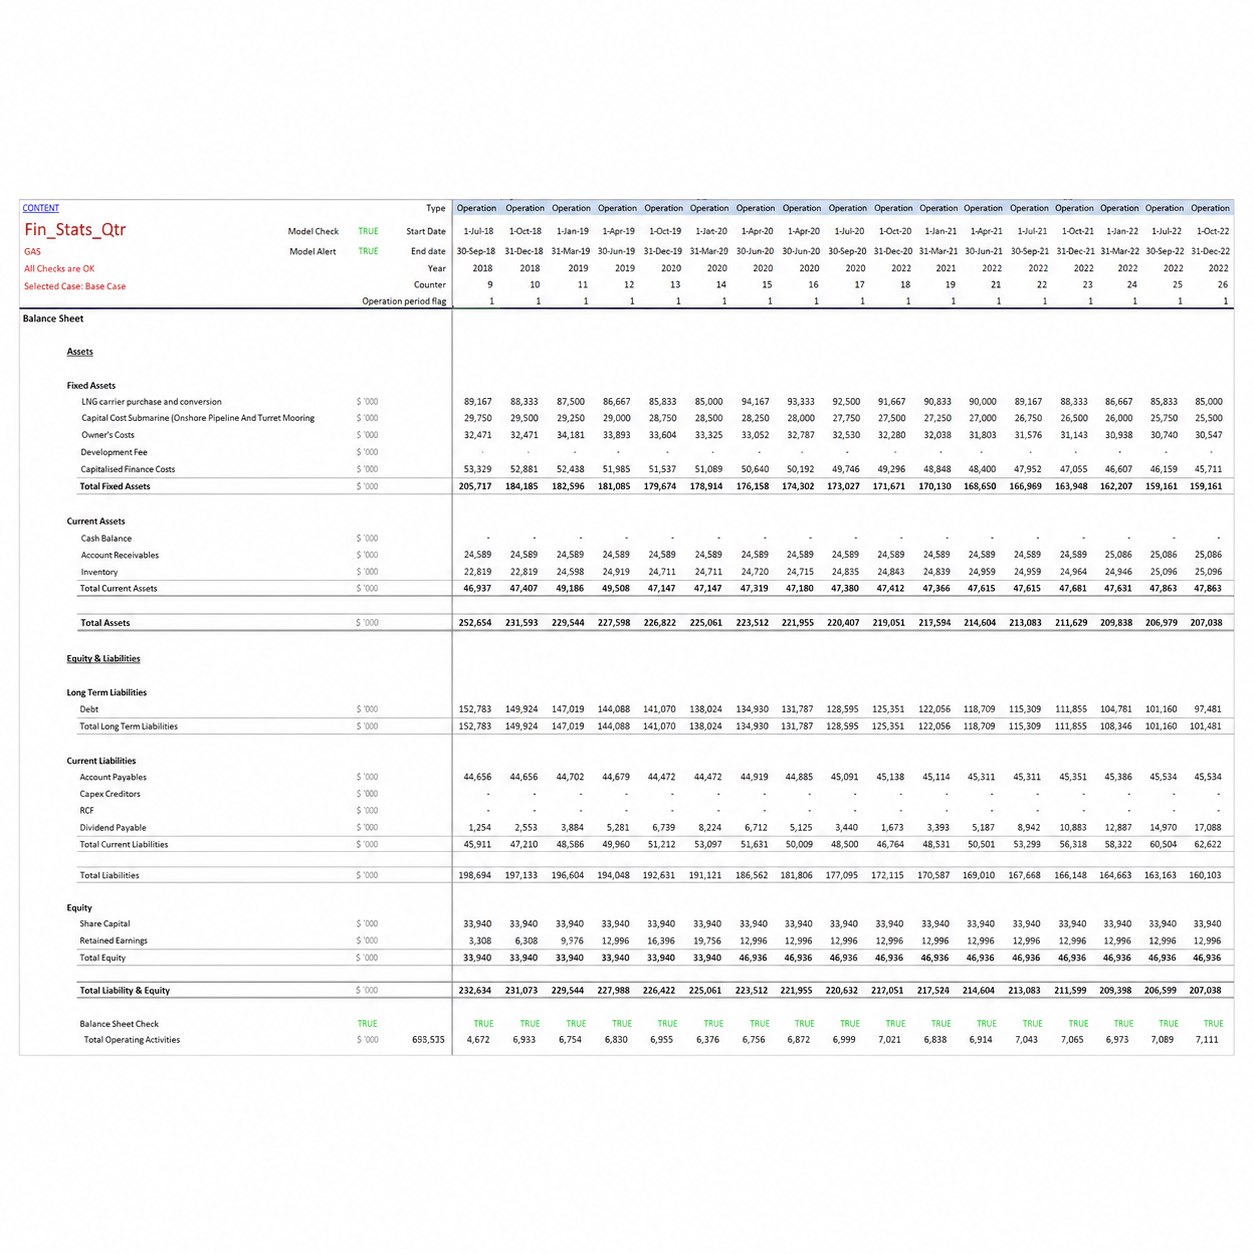
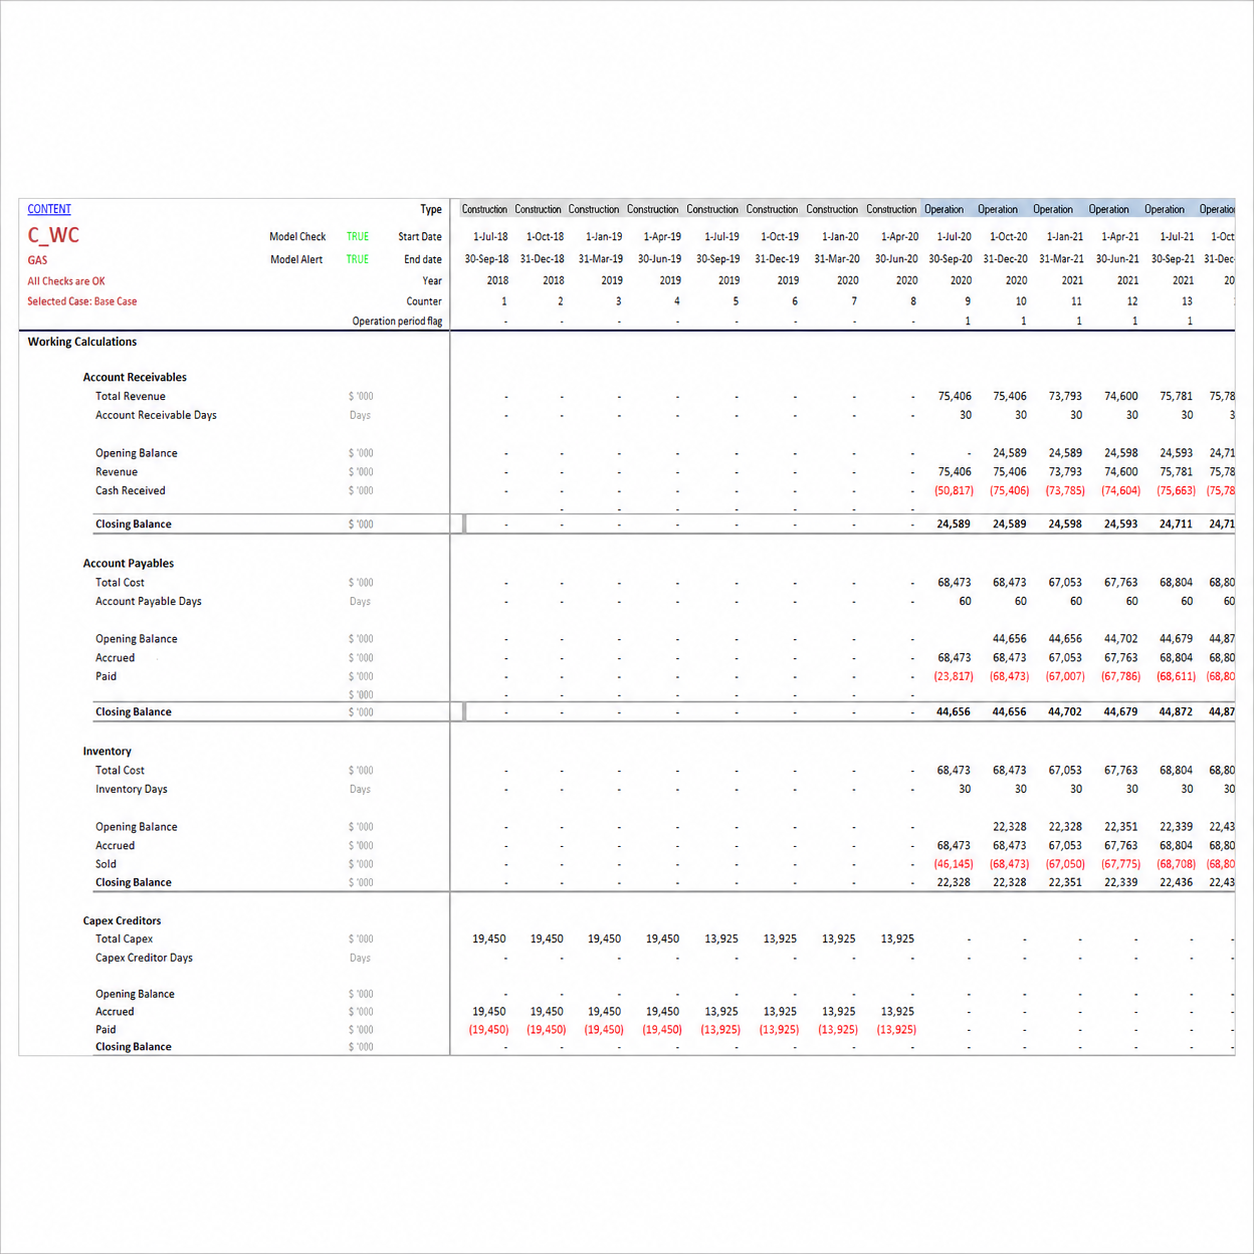
A detailed, institutional-grade gas distribution financial model built for a proposal to establish an LNG sales and distribution system — with three integrated statements, a cash waterfall, valuation and the full set of lender covenant metrics, in Excel.
Project finance is the financing of long-term infrastructure on the strength of the asset itself. Both debt and equity fund the project, and the debt is repaid from the cash flow the project generates — not from the balance sheets of its owners. That structure puts enormous weight on the model. If the projected cash flows cannot service the debt, the project does not get built, however attractive the underlying opportunity looks.
This gas distribution financial model is built for exactly that decision. It captures the full chain of a gas sales and distribution proposal — the carrier, the pipeline, the volumes sold and the cost of fuel — and resolves them into the metrics a sponsor, developer or lender needs to judge whether the structure holds together.
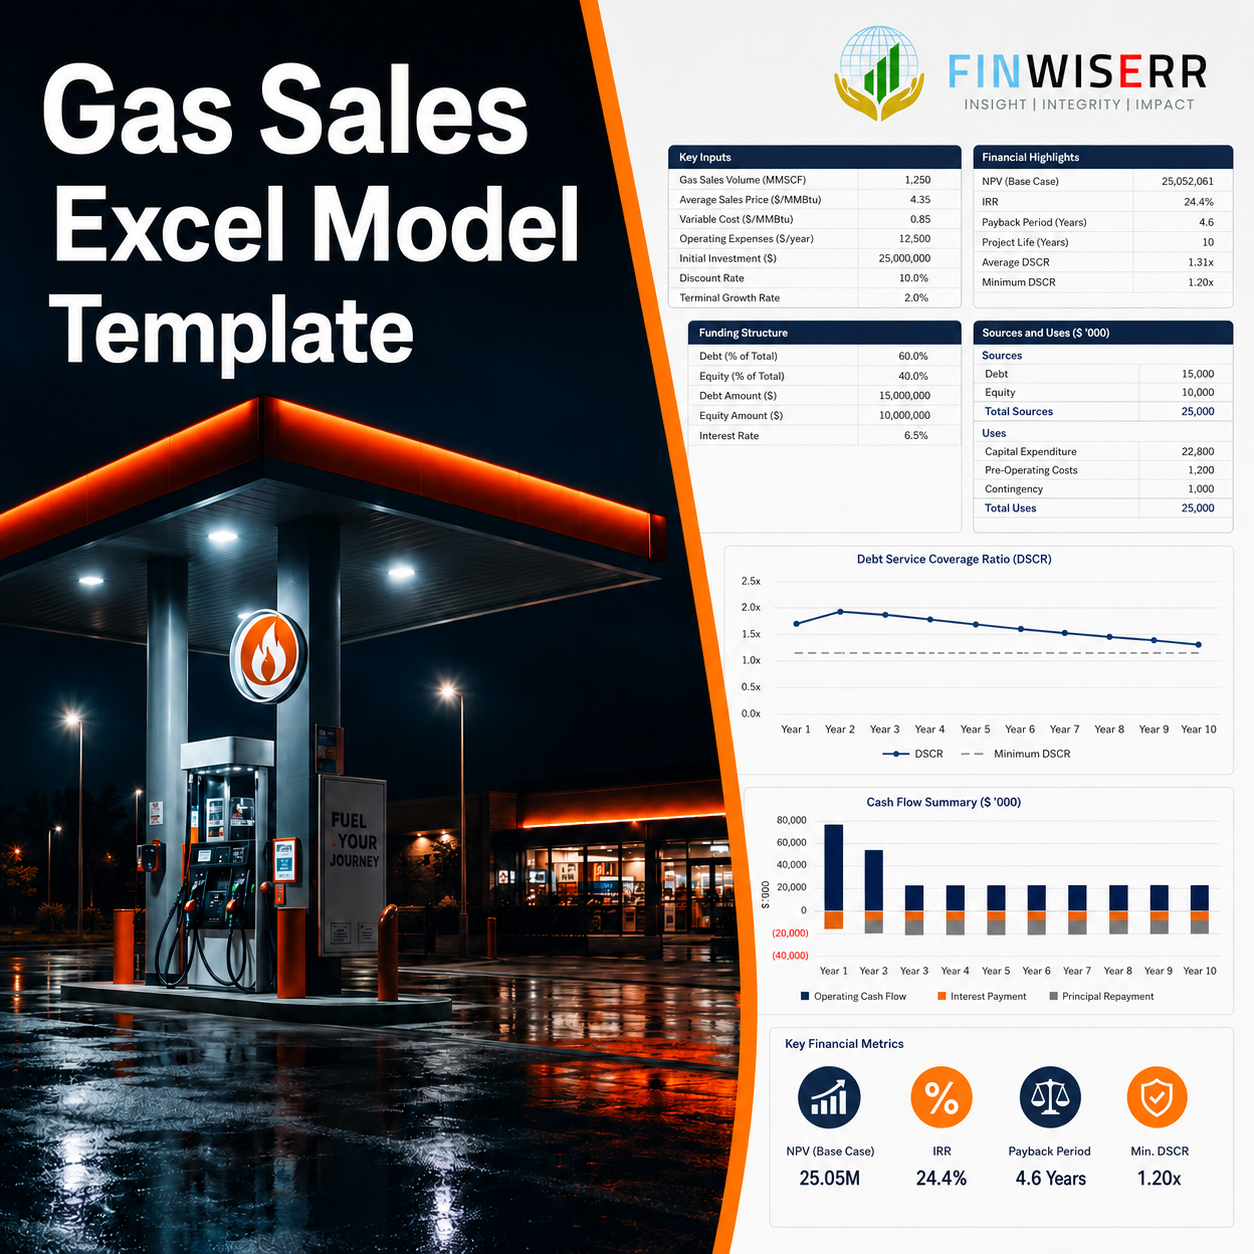
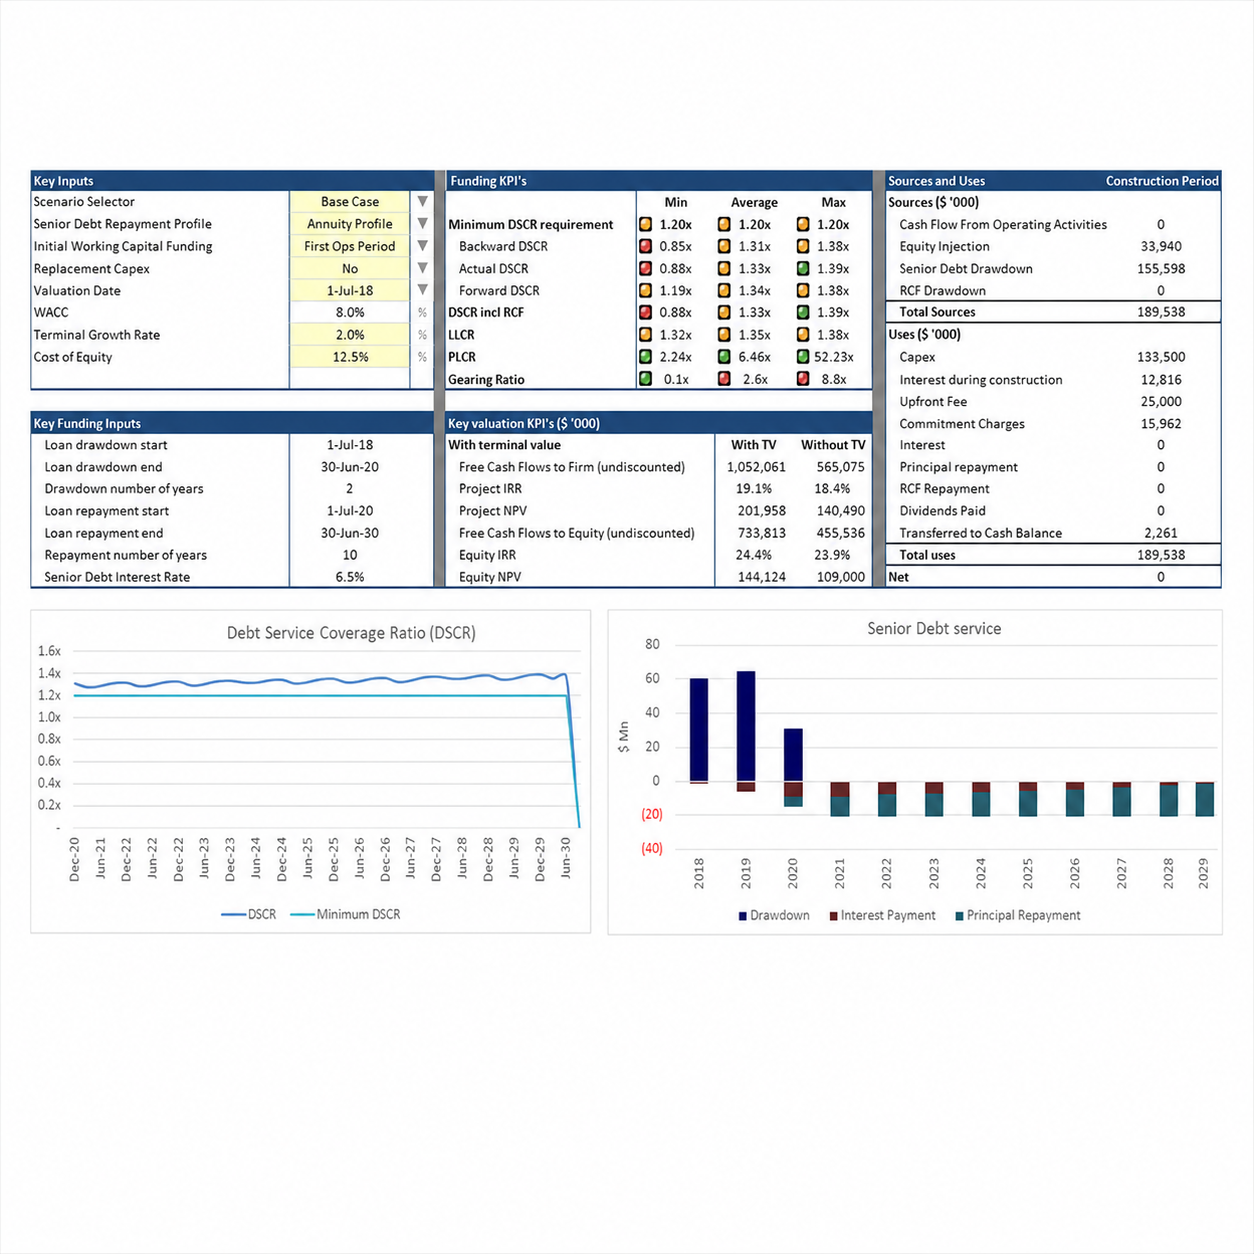
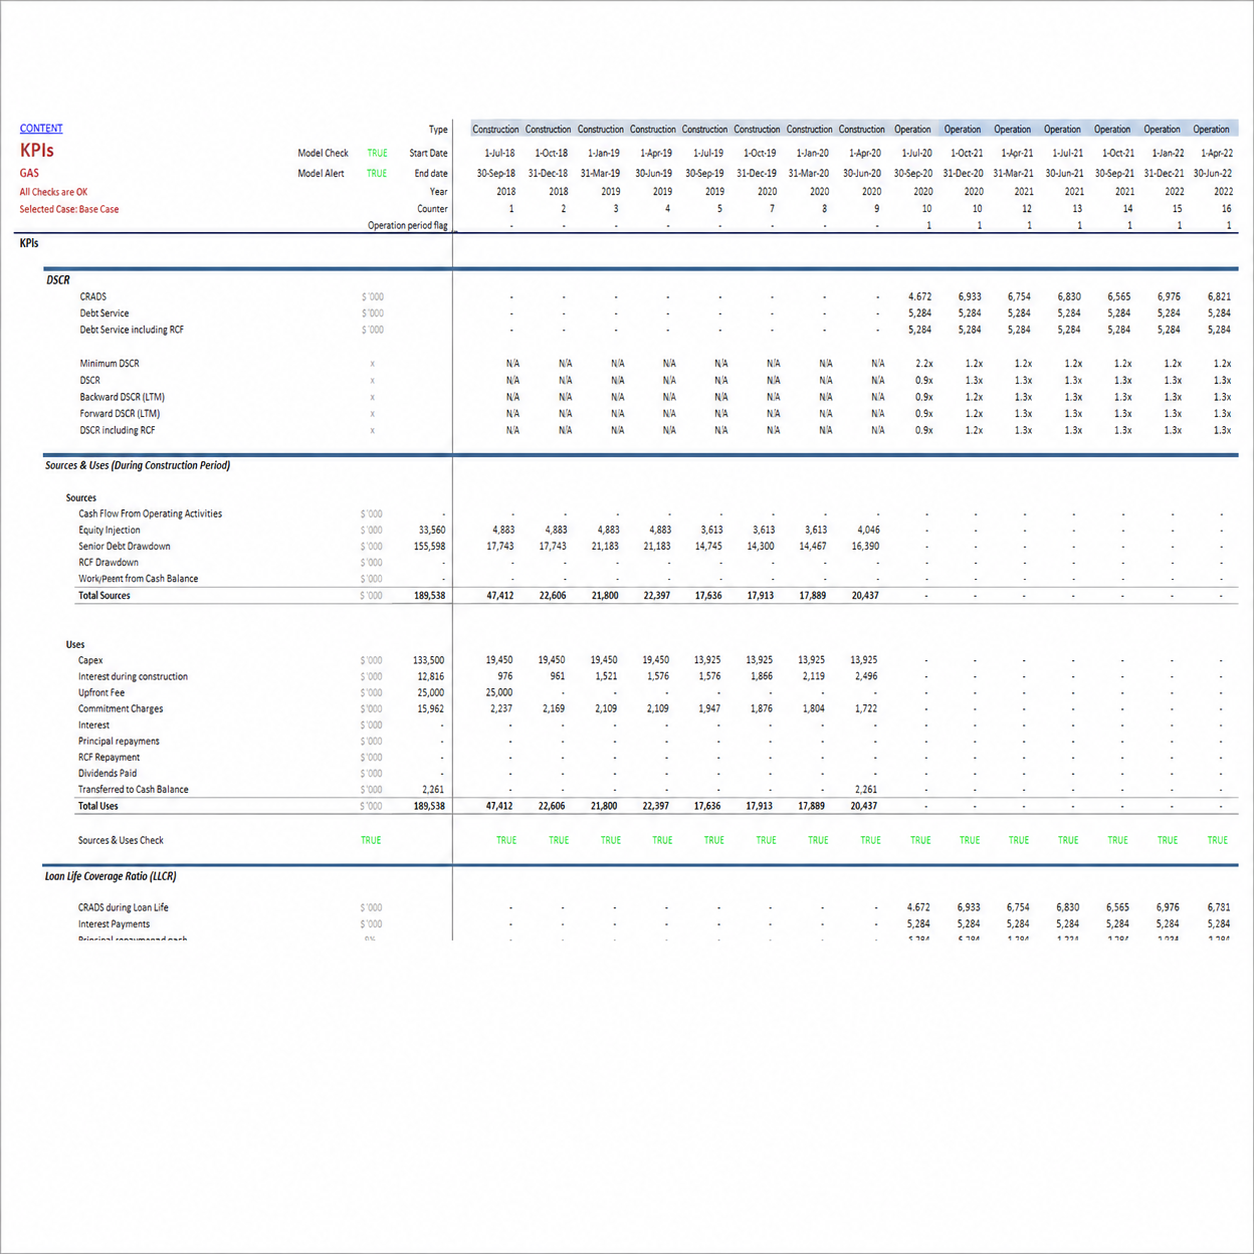
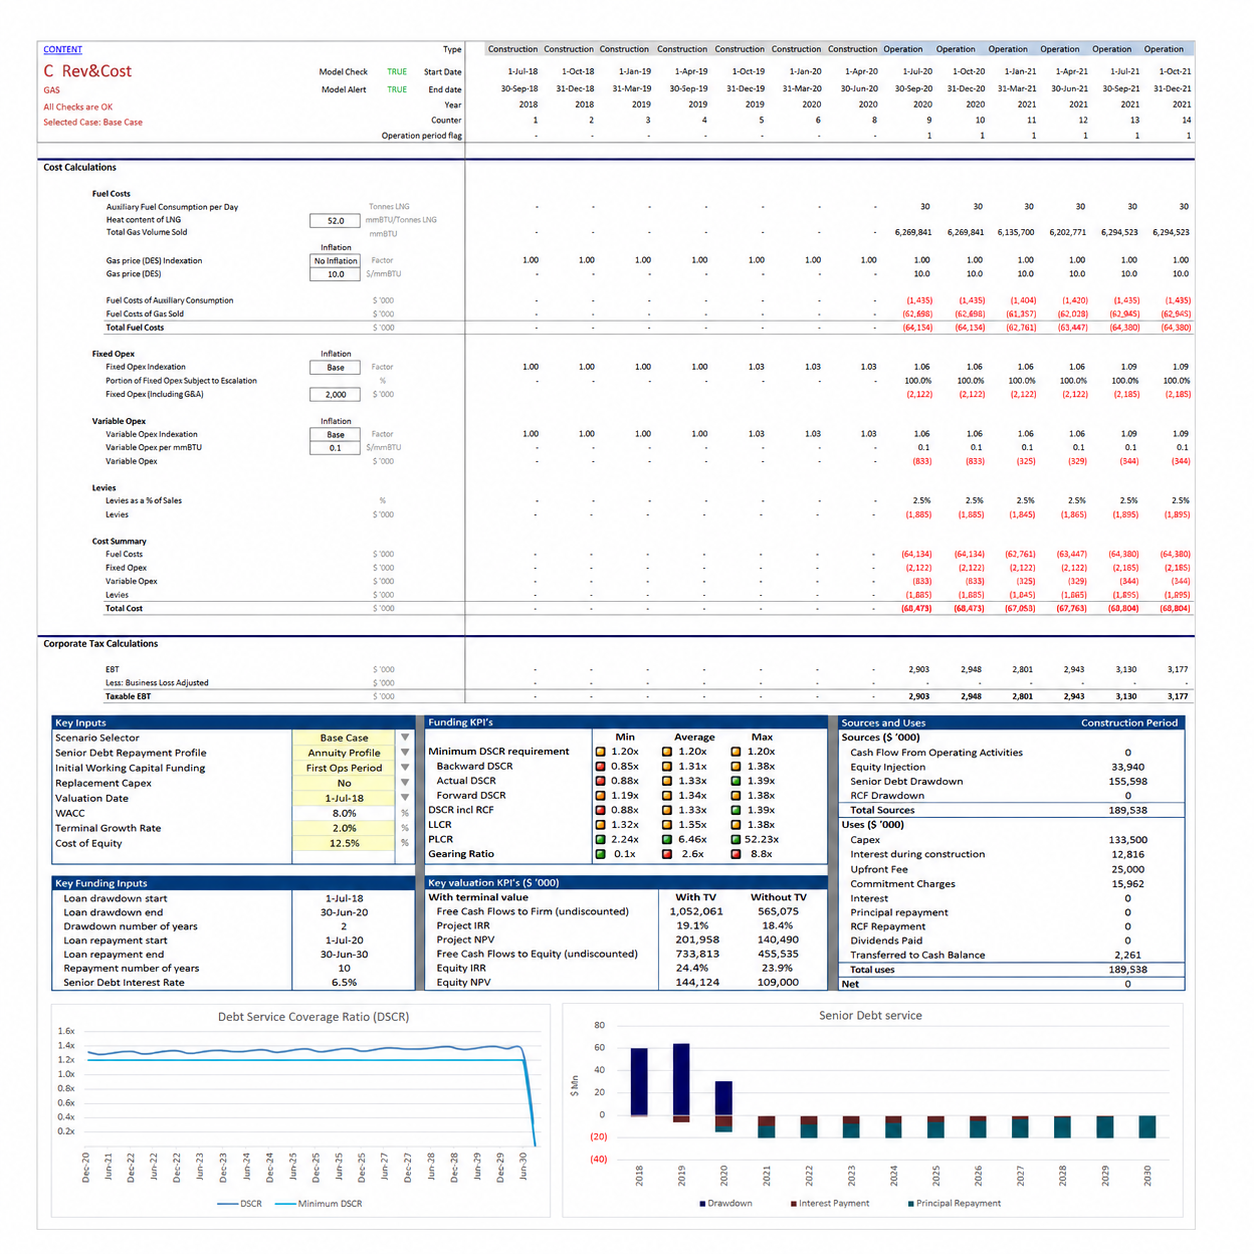
The outputs are the standard project finance suite: Project and Equity IRR and NPV, minimum and average DSCR, equity payback, a full cash waterfall and the debt service profile — the numbers a financing decision actually turns on.
A gas distribution business is a chain, and every link carries capital cost. The gas distribution financial model handles each explicitly — LNG carrier purchase and conversion capex at one end, pipeline and submarine capex in the middle, and offtake at the other.
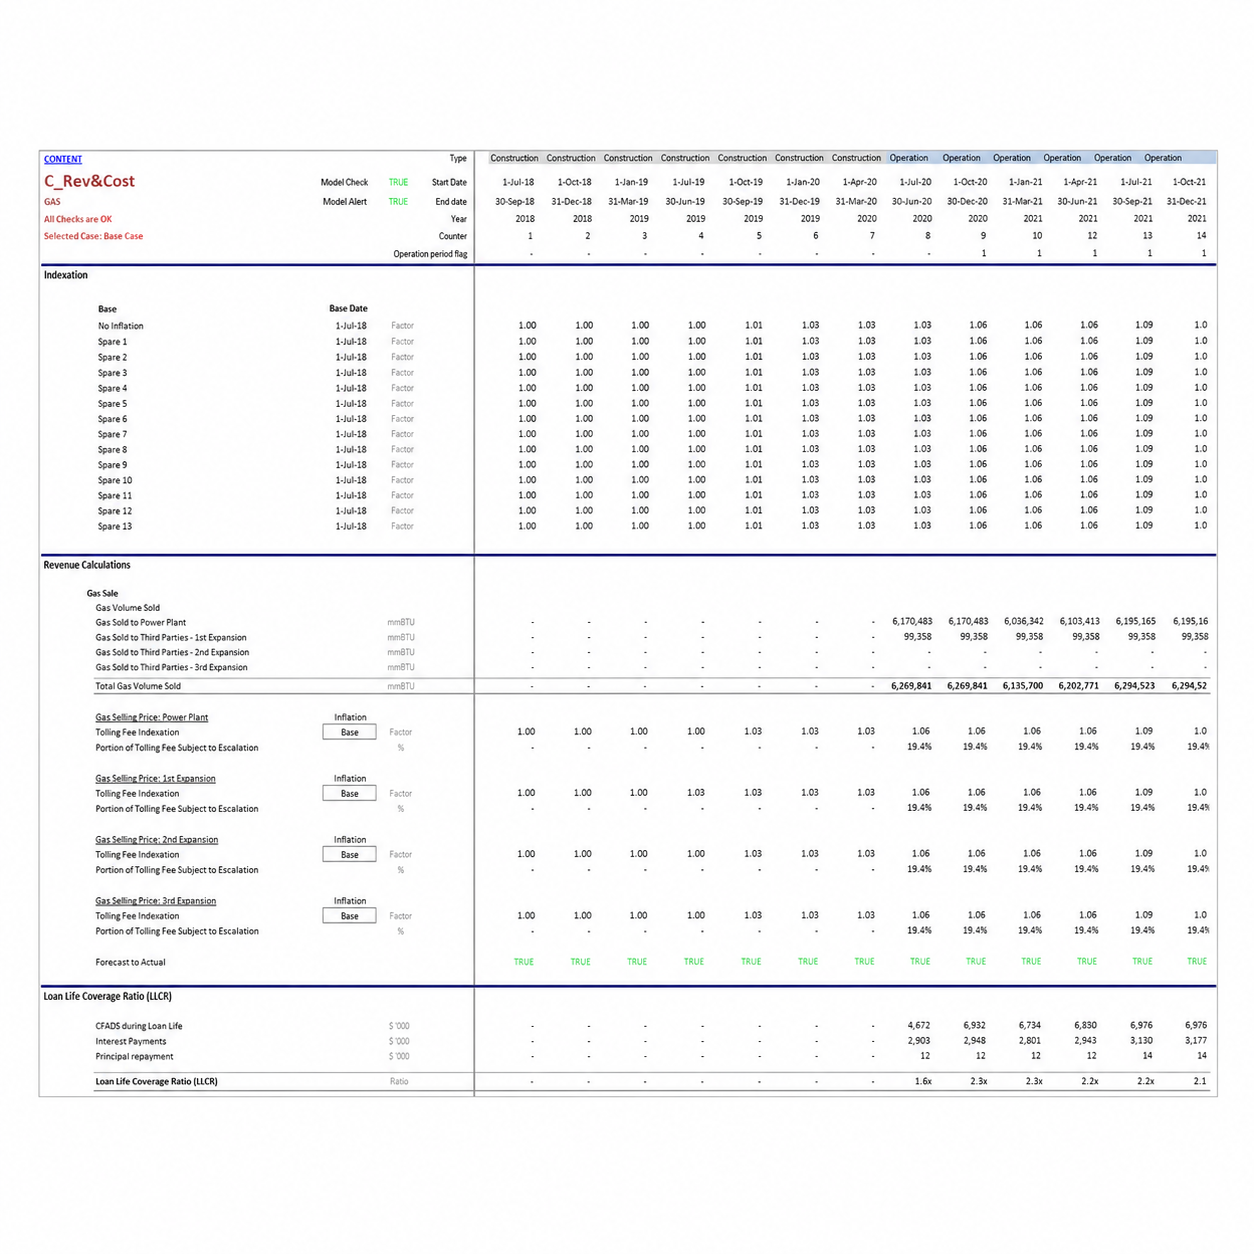
Volumes are split between gas sold to a power plant and gas sold to third parties, which matters more than it might appear. A power plant offtake is typically contracted and predictable; third-party sales are more variable but often better priced. Modelling them separately lets you test how the balance between anchor offtake and merchant sales affects both returns and debt capacity.
Every driver of viability is an explicit, editable input. The assumptions cover:
| LNG Carrier | Carrier purchase and conversion capital expenditure |
| Pipeline Infrastructure | Pipeline and submarine capital expenditure |
| Power Plant Offtake | Gas volume sold to the power plant |
| Third-Party Sales | Gas volume sold to third parties |
| Fuel Cost | Cost of gas purchased for onward sale |
| Capital Expenditure | Fixed and variable capex across the asset base |
| Capital Structure | Flexible debt and equity structuring across the funding stack |
This is where the gas distribution financial model earns its keep — resolving your assumptions into the metrics a financing decision turns on:
Beyond producing numbers for a specific proposal, this model is a working demonstration of how infrastructure project finance is put together. Work through it and you will see, in practice, how flexible capital structuring feeds the debt schedule, how a cash waterfall cascades through the priority of payments, and how DSCR, LLCR and PLCR are each constructed from the underlying cash flows.
That makes it useful for two quite different purposes: assessing a live gas distribution proposal, and refreshing or building project finance modelling skills against a real structure rather than an abstract example.
Carrier, pipeline and submarine costs are modelled separately, so you can see where the capital actually goes.
Power plant and third-party volumes sit apart, so you can test the balance between contracted and merchant sales.
Clearly defined input, calculation and output cells, so you can audit the logic end to end or adapt it to your own proposal.
New to these metrics? Read an overview of the debt service coverage ratio. For a model built to your own specification, see our project finance advisory services, or browse the full range of PPP and project finance templates.
Carrier and pipeline capex, split offtake volumes, a full cash waterfall and every lender metric from Project IRR to PLCR — ready in Excel.