$120.00
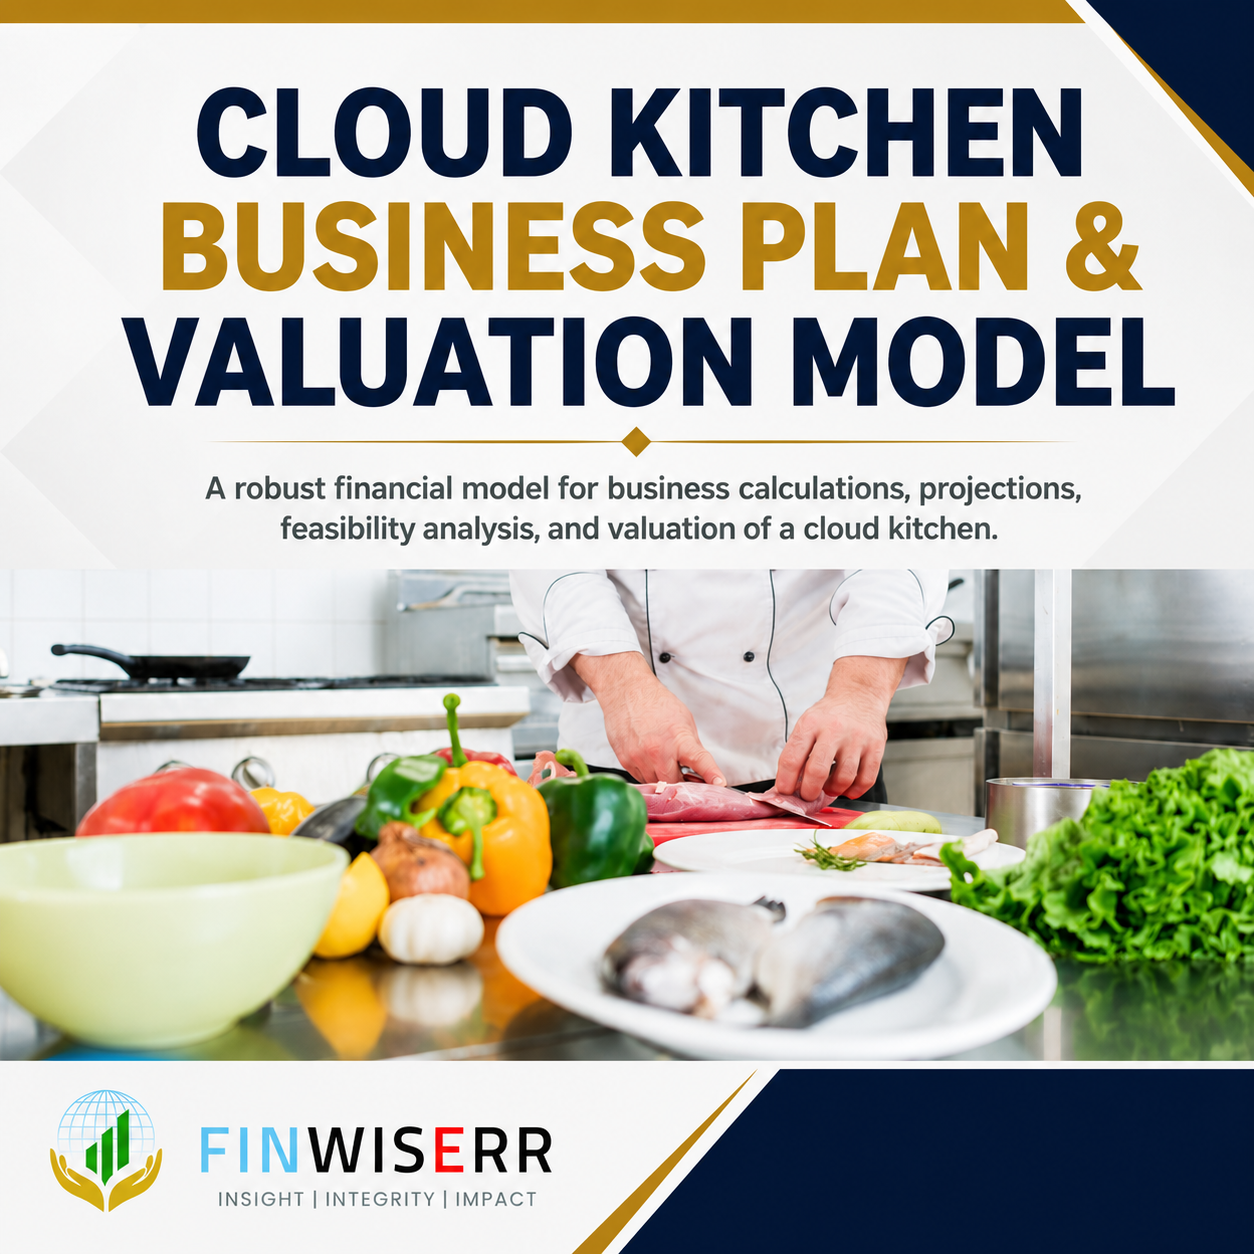
A detailed, investor-ready cloud kitchen financial model for a delivery-only food business — with order-volume-driven revenue, third-party platform economics, multi-item baskets and catering income, plus construction and operation phases, break-even analysis and valuation, in one integrated Excel model.
A cloud kitchen lives or dies on two numbers: how many orders it fills, and how much each one costs to fulfil once the delivery platform has taken its cut. There is no dining room, no waiting staff, no footfall — the entire business is order volume, basket size and the margin that survives after the third-party platform fee. That makes it a fundamentally different business from a restaurant, and one that a standard hospitality template models badly.
This cloud kitchen financial model is built for the delivery-only reality. Revenue is driven from average daily orders with a growth ramp, split across main course, beverage and starter items with different midweek and weekend behaviour, and the crucial third-party platform fee is modelled explicitly as a percentage of the sales that flow through it. Catering adds an event-driven revenue line on top.
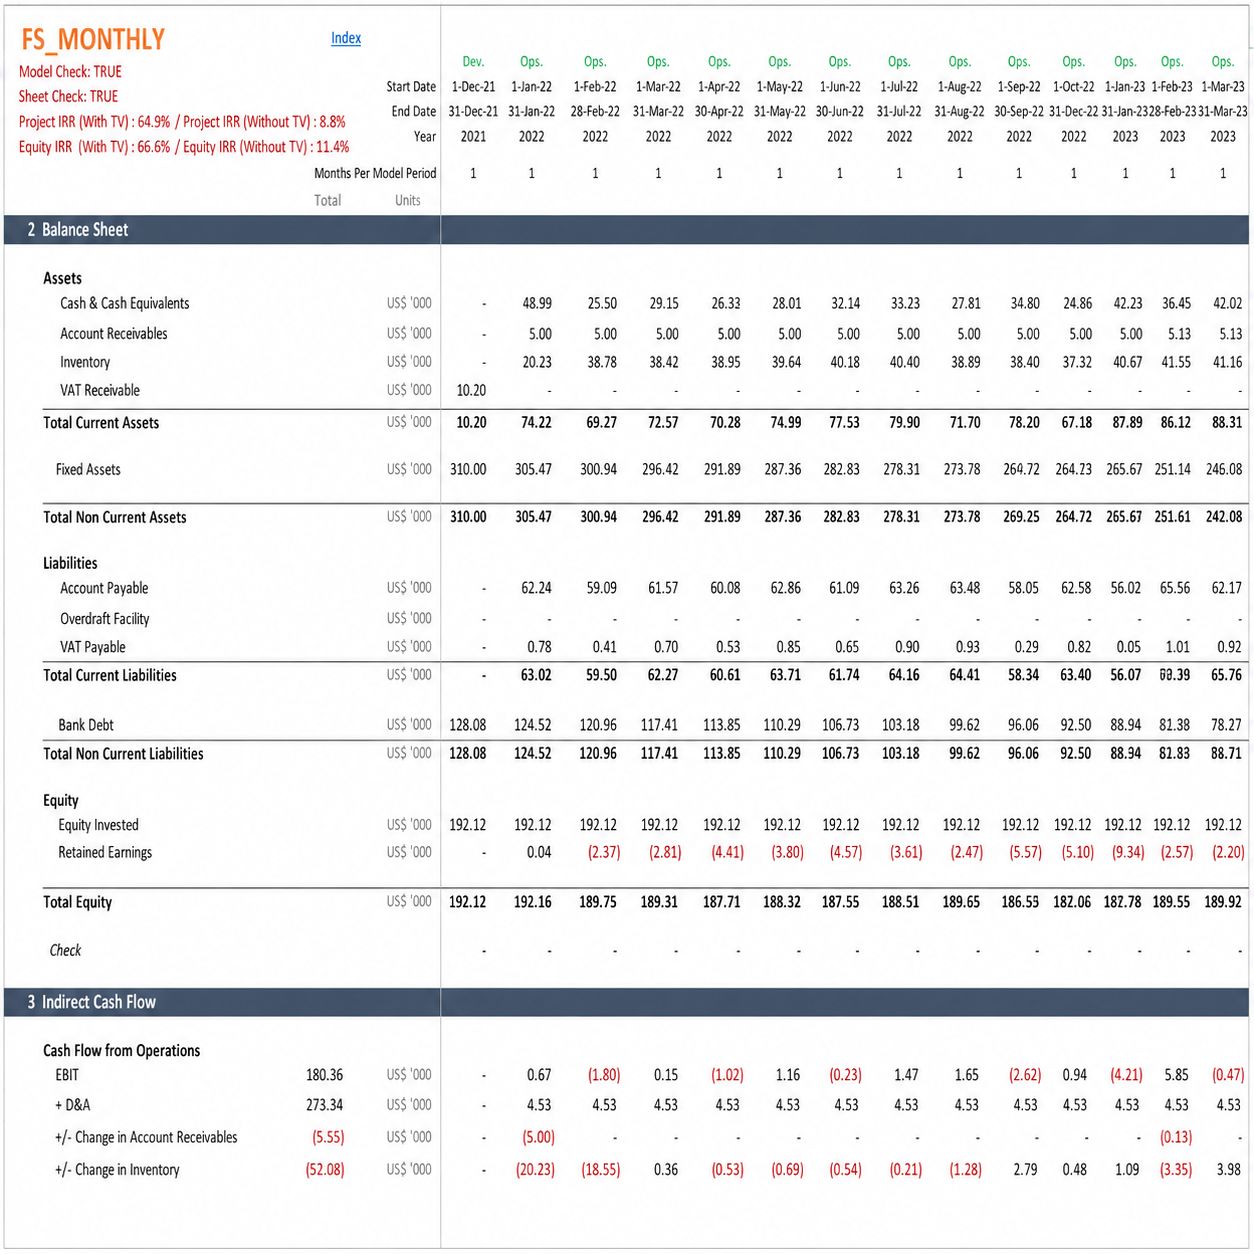
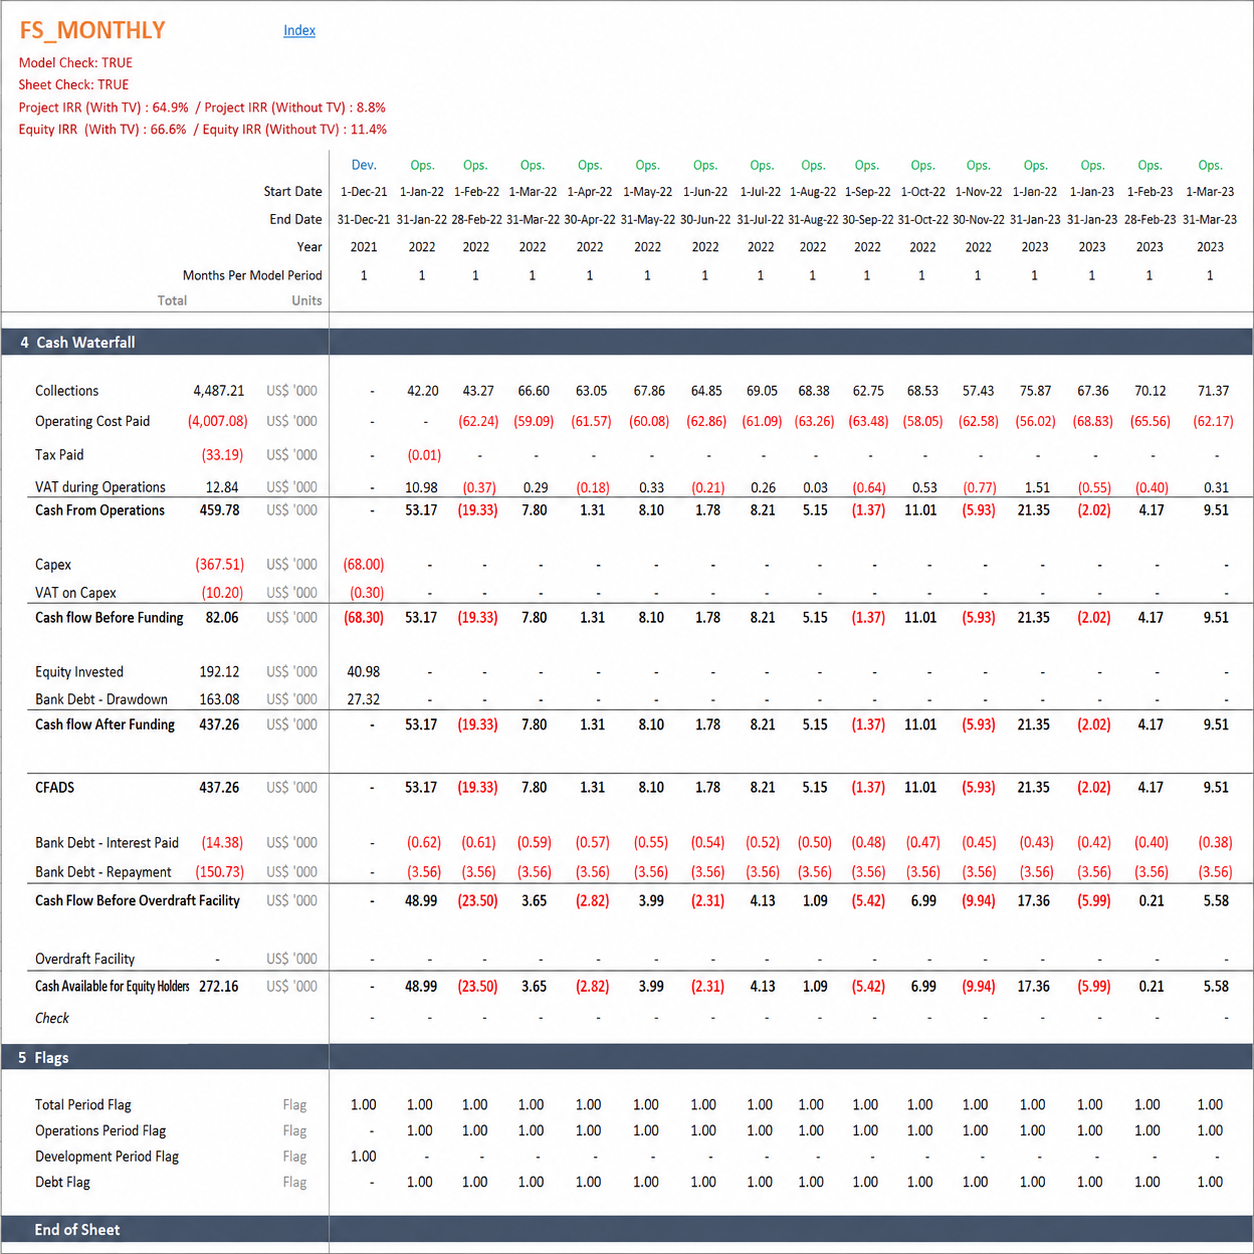
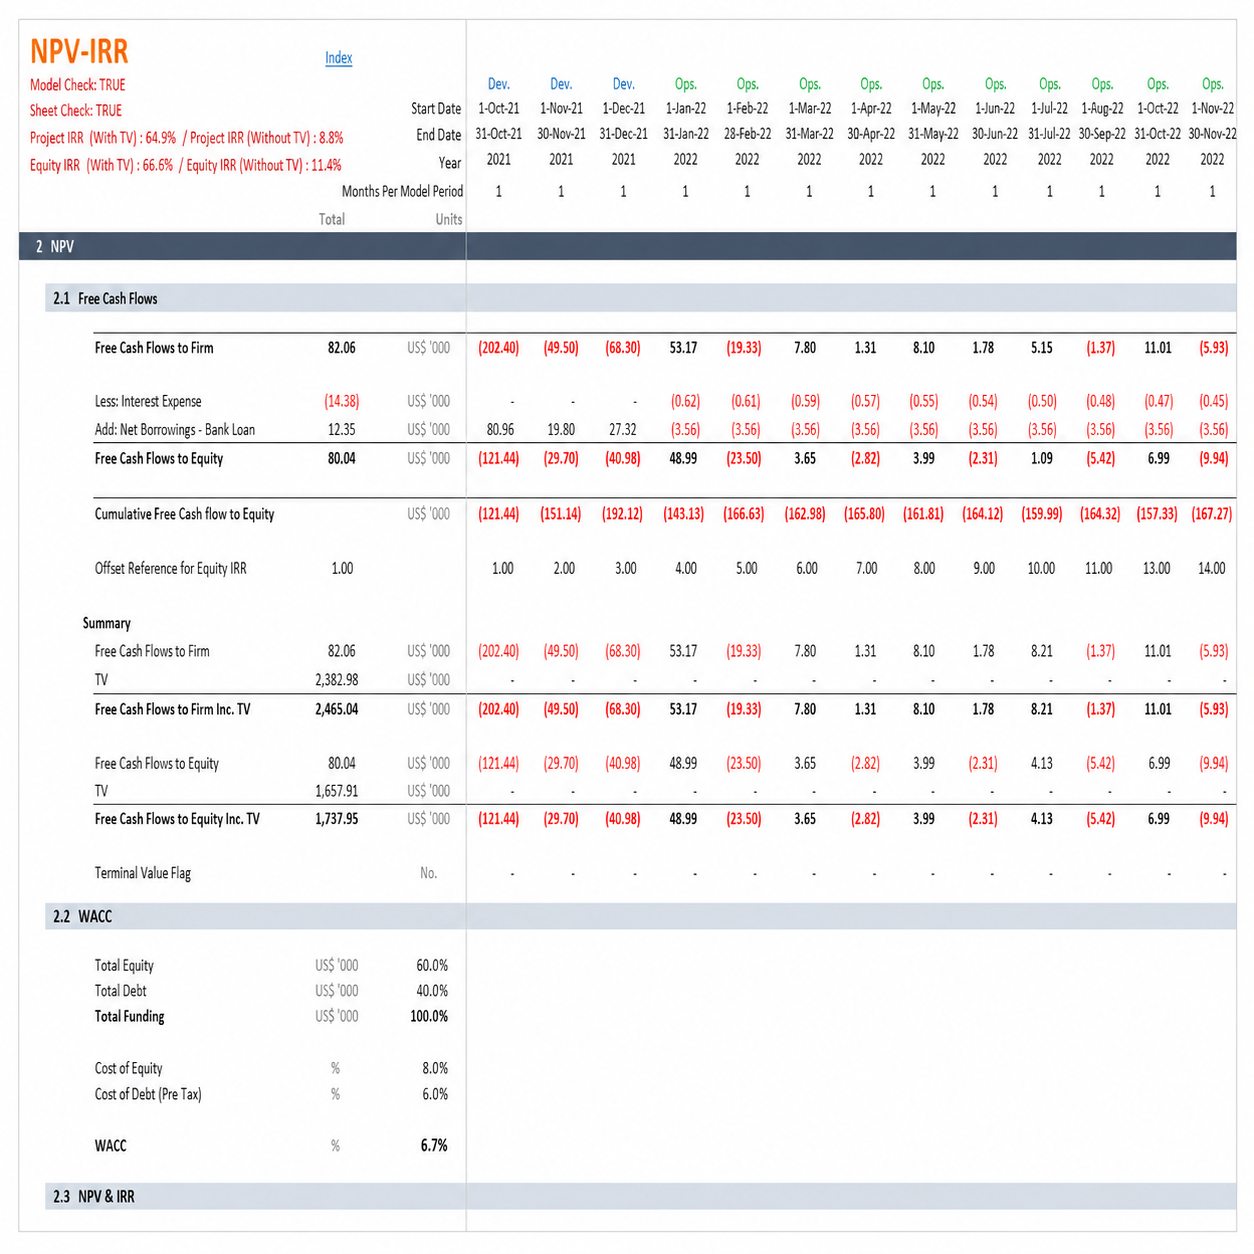
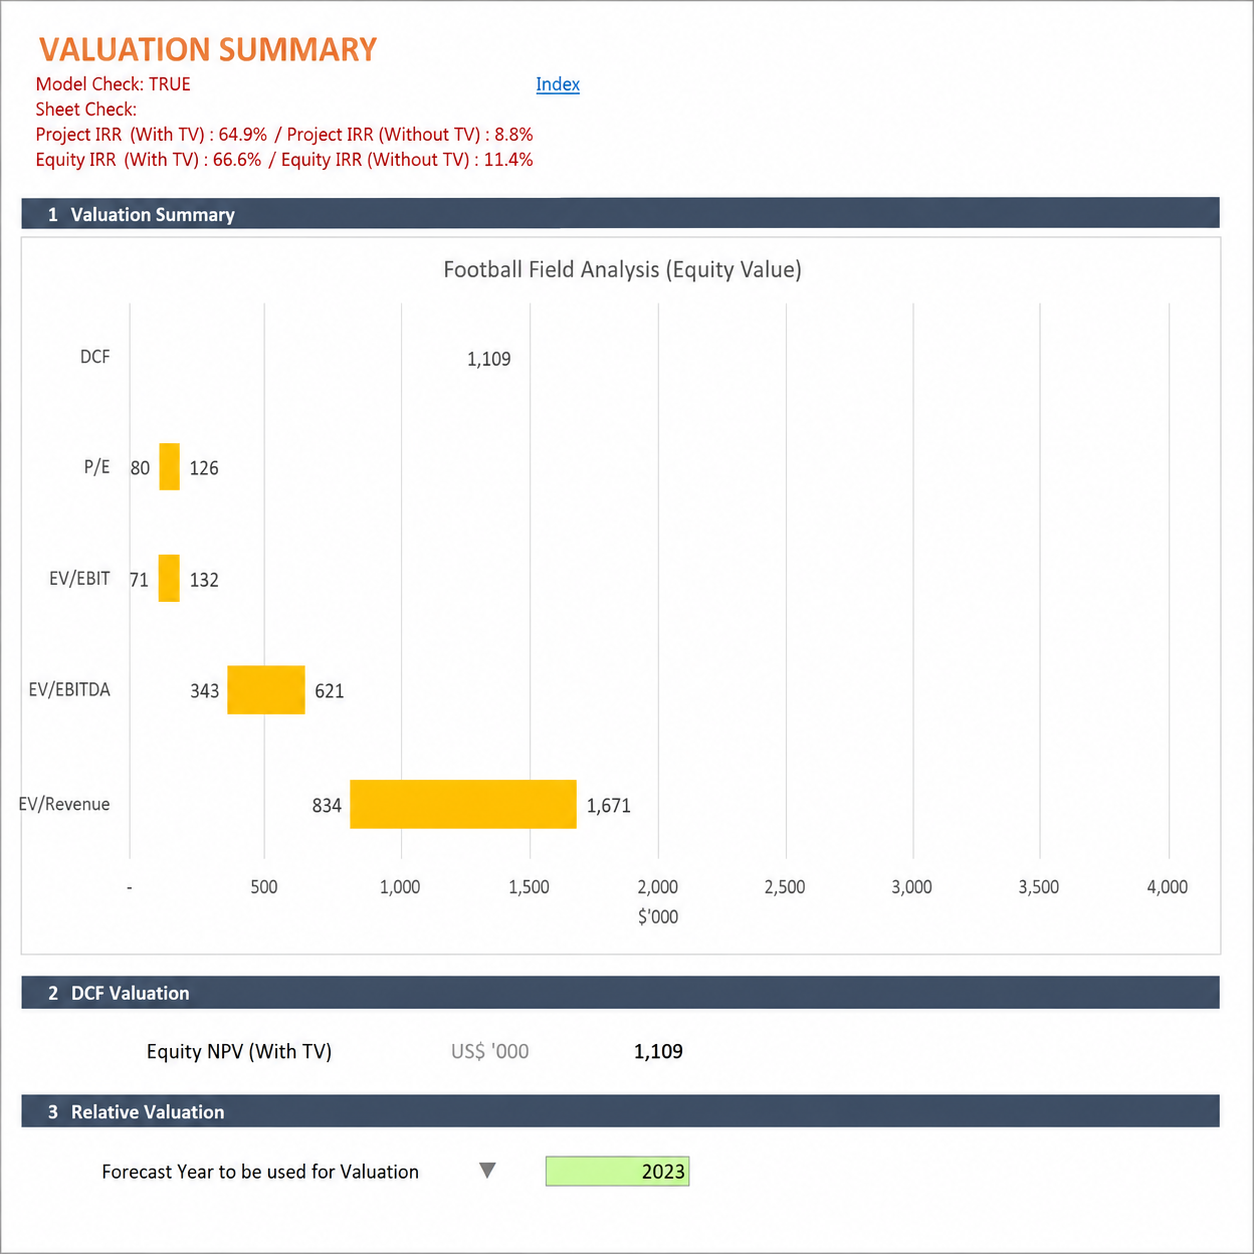
The output set is comprehensive: Project and Equity IRR and NPV (with and without terminal value), equity payback, break-even analysis, a DCF valuation and a fully linked dashboard.
Revenue starts with average daily orders and an annual growth rate across the five operating years, converted through an order-to-delivery ratio. Each order is a basket, not a single item: main course quantity per customer, the share of customers adding a beverage, and starter revenue as a percentage of the rest — all modelled separately for midweek versus weekend and holiday demand, because a delivery kitchen’s weekends look nothing like its Tuesdays.
Then comes the number that defines cloud-kitchen economics: the third-party platform fee. The model captures what share of your food and beverage sales flow through delivery platforms, and charges the commission on exactly that share. Getting this right is the difference between a plan that looks profitable and one that actually is — because for most cloud kitchens, the platform is the single largest deduction between revenue and margin.
Every driver of the business is an explicit, editable input. The assumptions cover:
| Order Volume | Average daily orders, annual growth rate over five years, and order-to-delivery conversion |
| Basket & Pricing | Main course quantity per customer, beverage attach rate and starter share — split midweek versus weekend — with average prices |
| Platform & Catering | Share of sales via third-party platforms, catering events per month and catering charges, plus other revenue |
| Variable Cost | Food, beverage, snack, catering and other-revenue cost as a percentage of revenue, plus the third-party platform fee |
| Fixed Costs | Management salary, platform AMC, staff cost, SPV cost, insurance, security and licence |
| Capex | Machinery and equipment, computer and hardware, furniture and setup cost, with refresh capex at end of life |
| Financing | Debt-equity ratio, construction and operations debt, term, drawdown and repayment schedule |
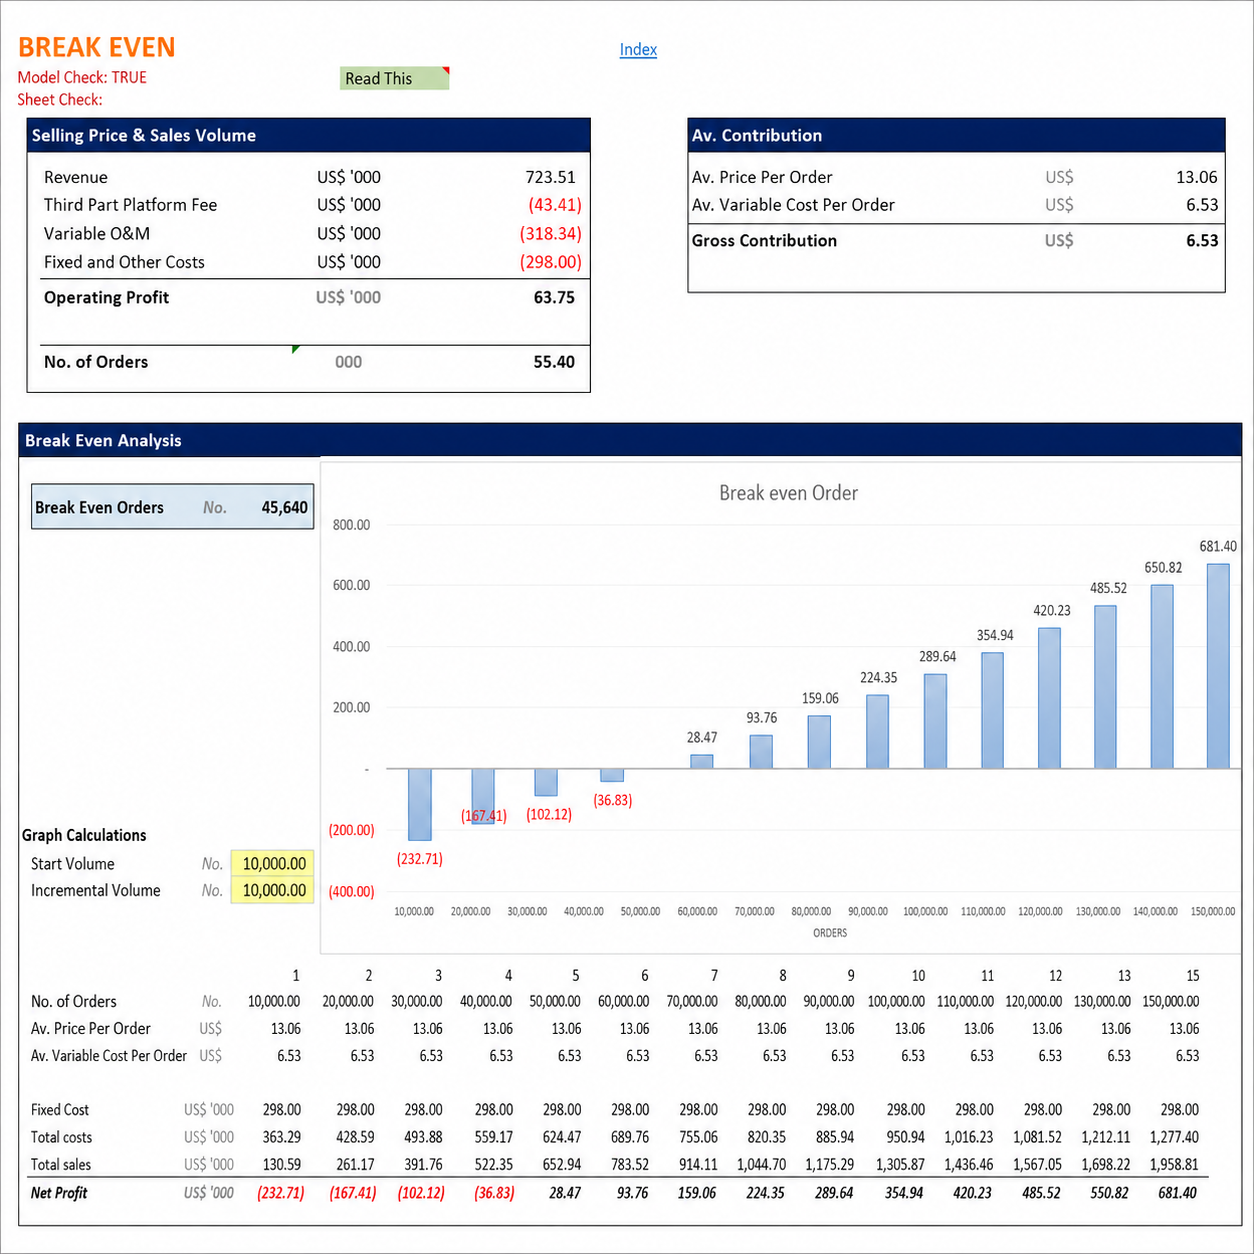
A dedicated break-even analysis shows the order volume at which the kitchen covers its costs — the single most important milestone for a delivery business, and the first thing an investor asks about. Alongside it, a full DCF valuation derives Project and Equity NPV and IRR both with and without terminal value, so you can see how much of the value rests on the exit assumption versus the operating years themselves.
The model forecasts across construction and operation on a monthly basis, with financial statements on both monthly and annual views. Every revenue and cost assumption can be entered across three scenarios and switched at the click of a button, so a slow order ramp sits beside an aggressive one — and because the model uses no macros, every change flows through instantly.
Commission charged on exactly the share of sales that flow through delivery apps — the deduction that defines the margin.
Main, beverage and starter with midweek and weekend patterns, so order value is built from the ground up.
The order volume that covers costs, plus a full DCF valuation with and without terminal value.
New to these metrics? Read an overview of internal rate of return. For a model built to your own specification, see our financial advisory services, or browse the full range of business plan Excel models.
Order-driven revenue, platform-fee economics, multi-item baskets and catering, break-even and valuation — five years of monthly projections, ready in Excel.