$99.00
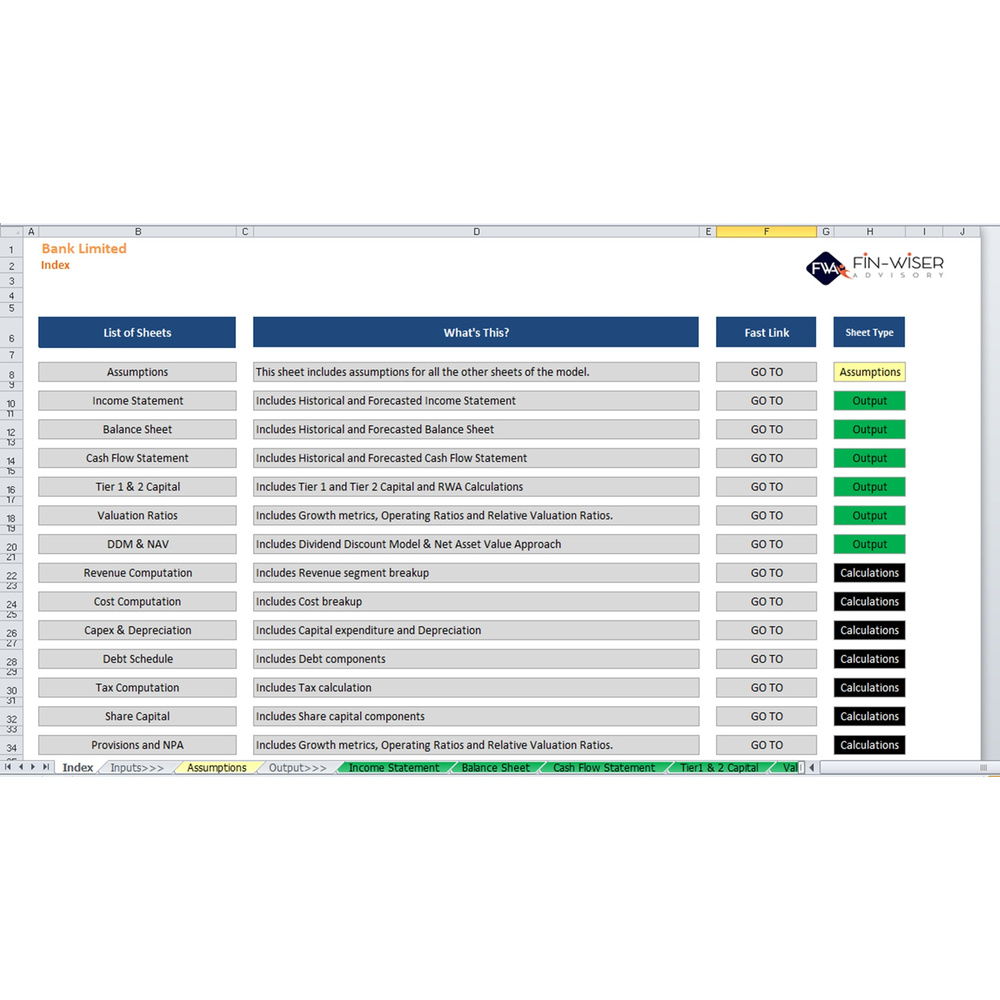
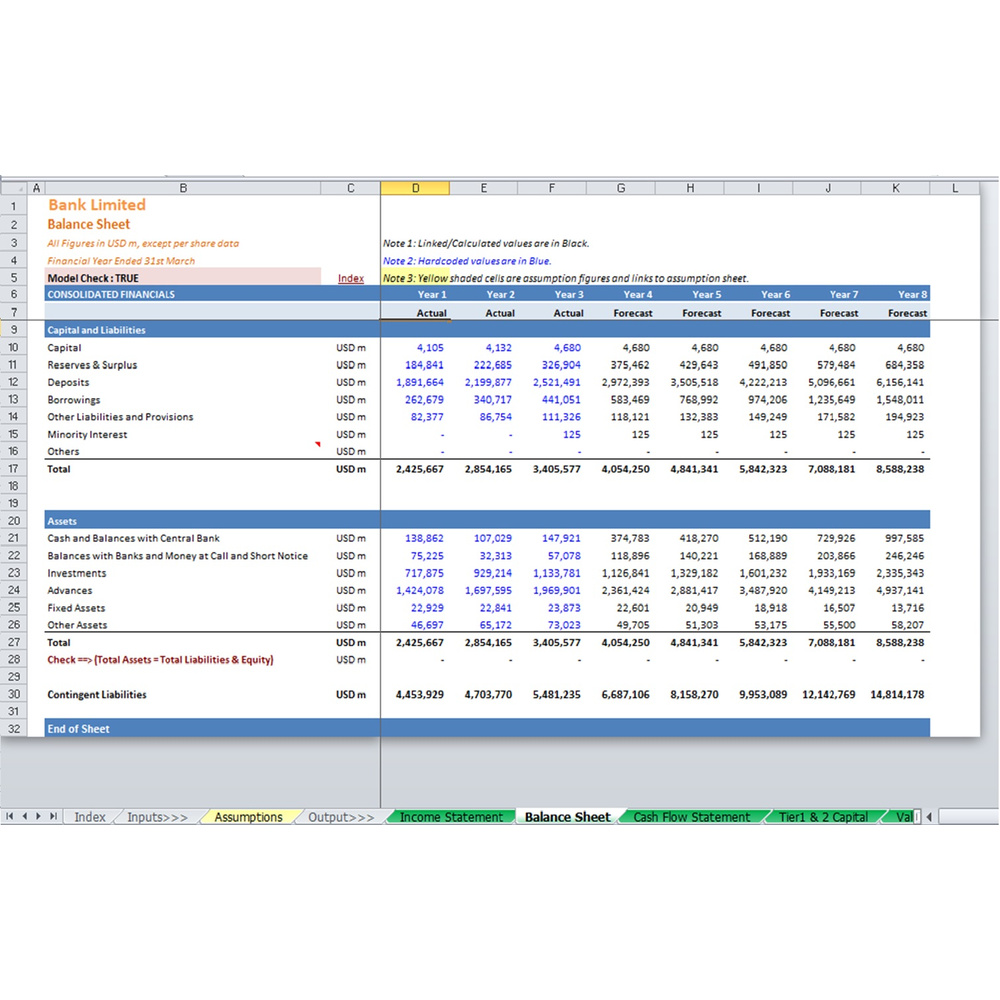
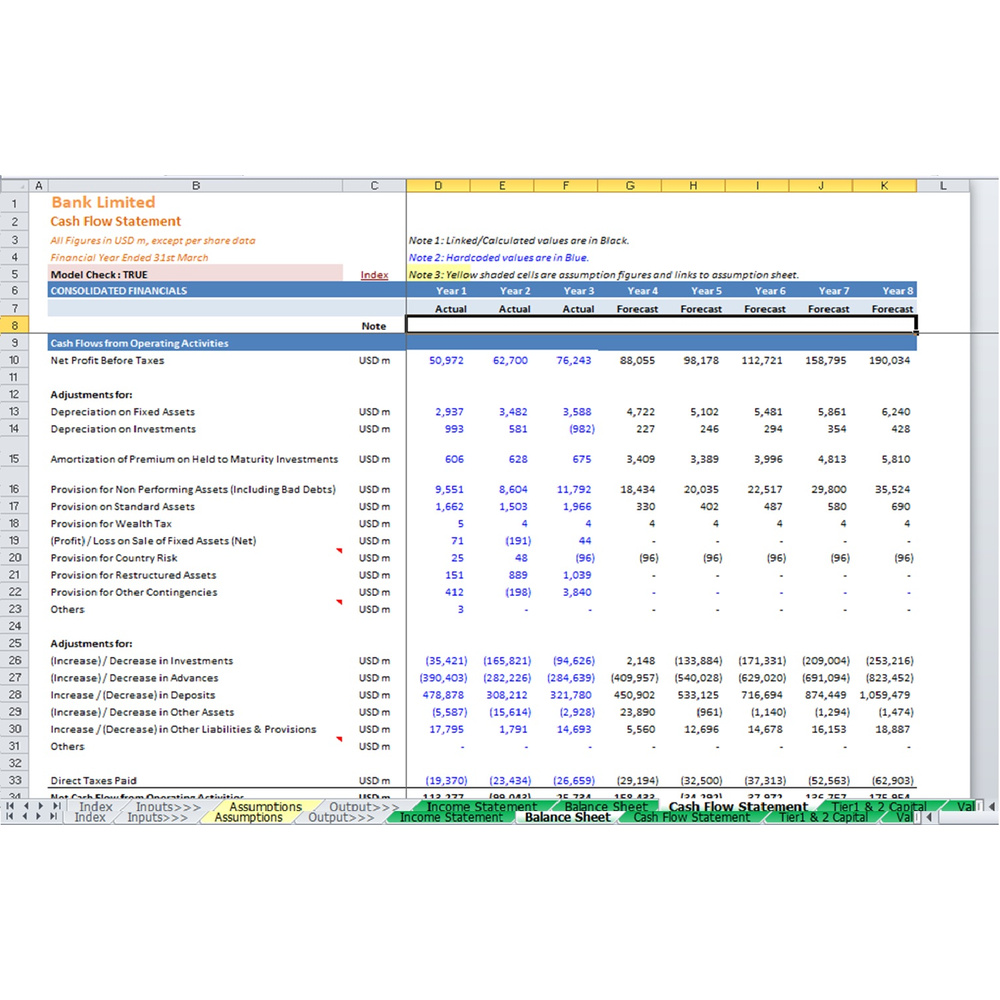
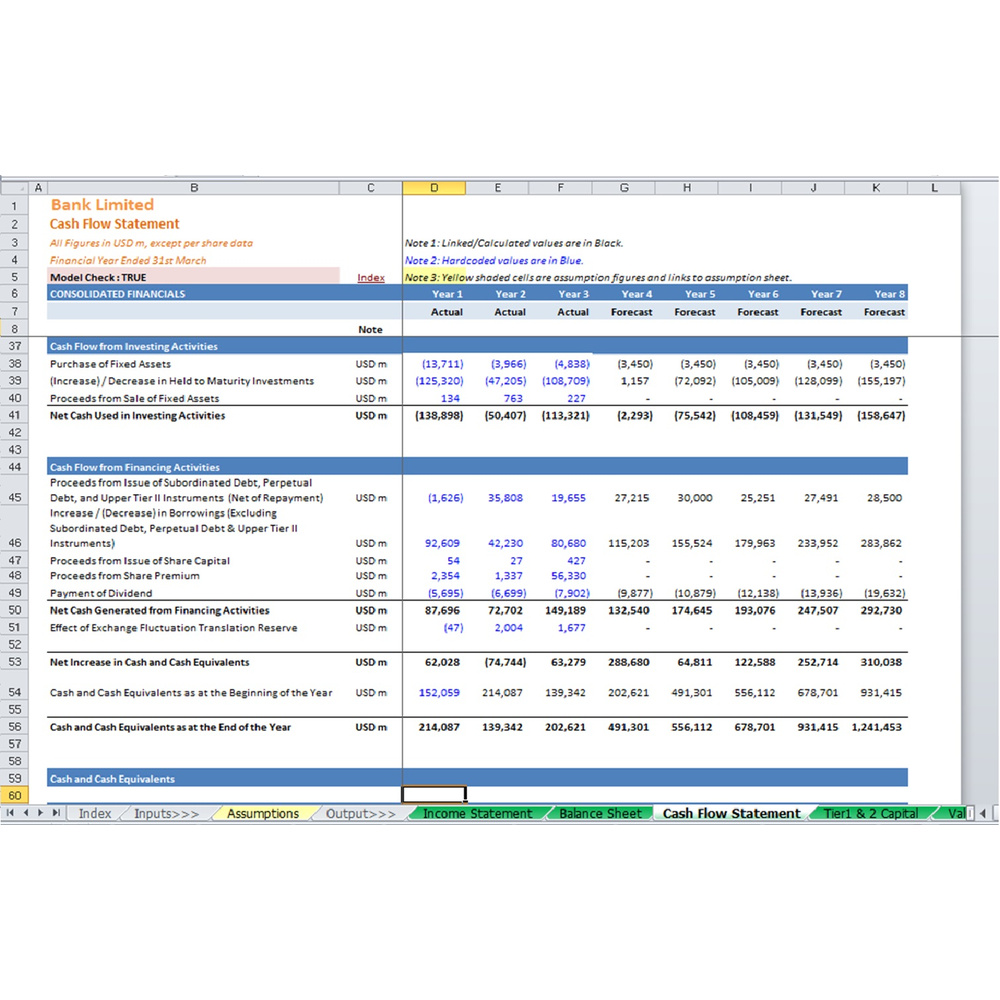
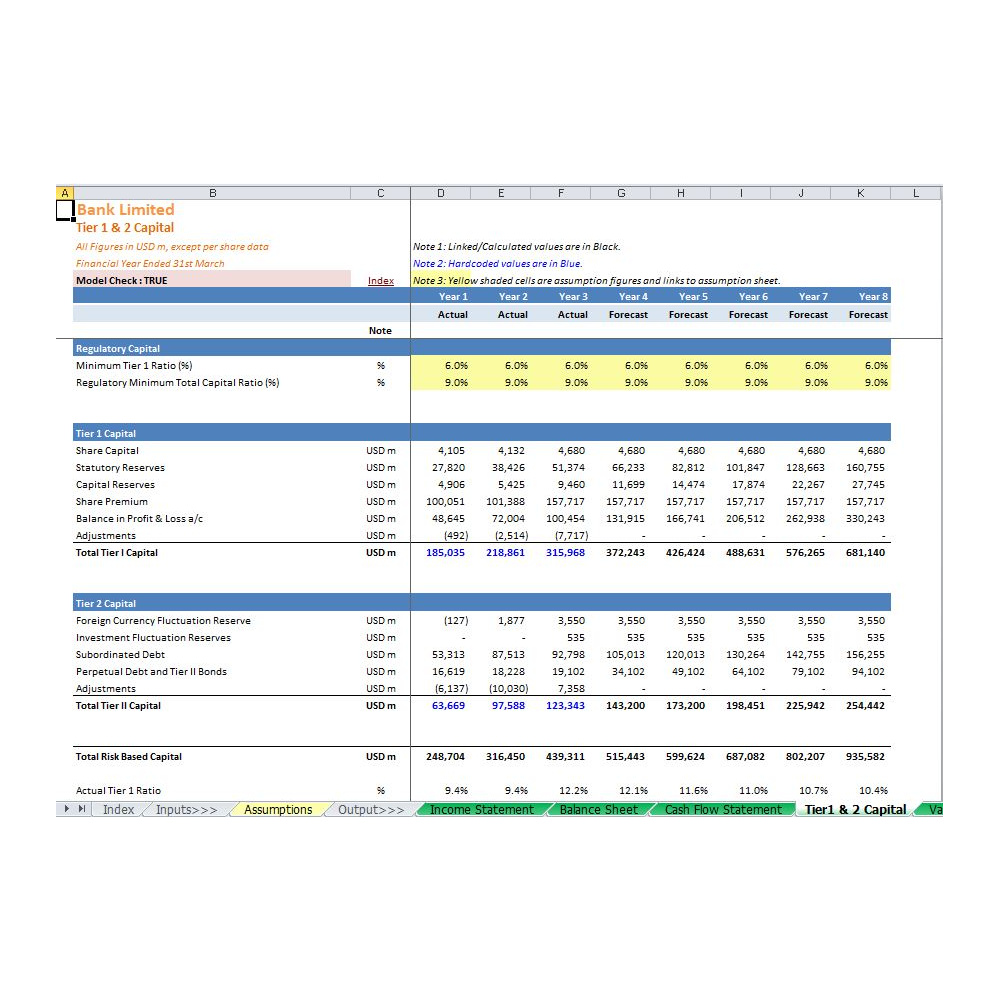
A detailed, user-friendly Bank Valuation Model built on the Dividend Discount Model (DDM) and Net Asset Value (NAV) approaches, with fully integrated financial statements.
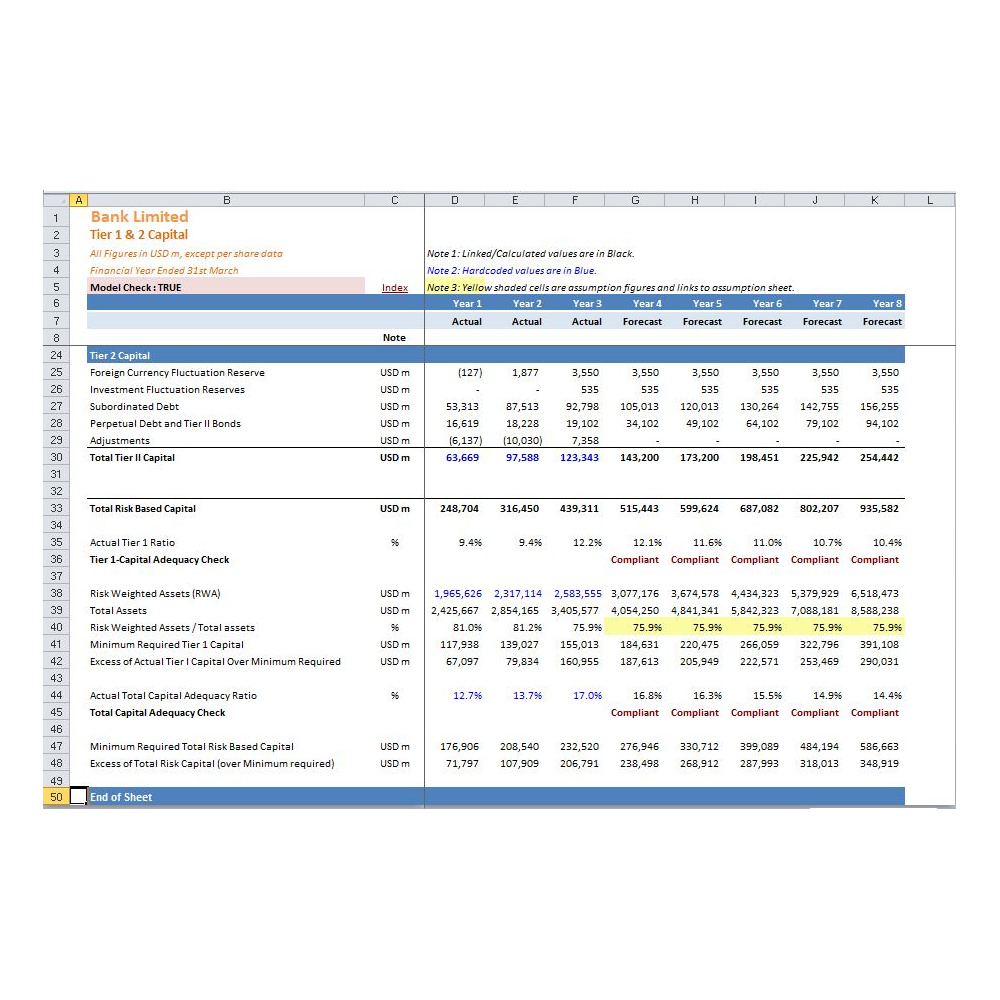
Banks don’t value like ordinary companies. Deposits are liabilities that fund the business, capital adequacy governs how much can be lent, and free cash flow is a poor guide to what shareholders actually receive. This model is built for that reality — valuing the bank on the dividends it can sustainably pay and the net assets behind each share.
The model covers 3 years of historical data and a 5-year forecast period, with valuation driven by the forecast under both DDM and NAV methodologies.
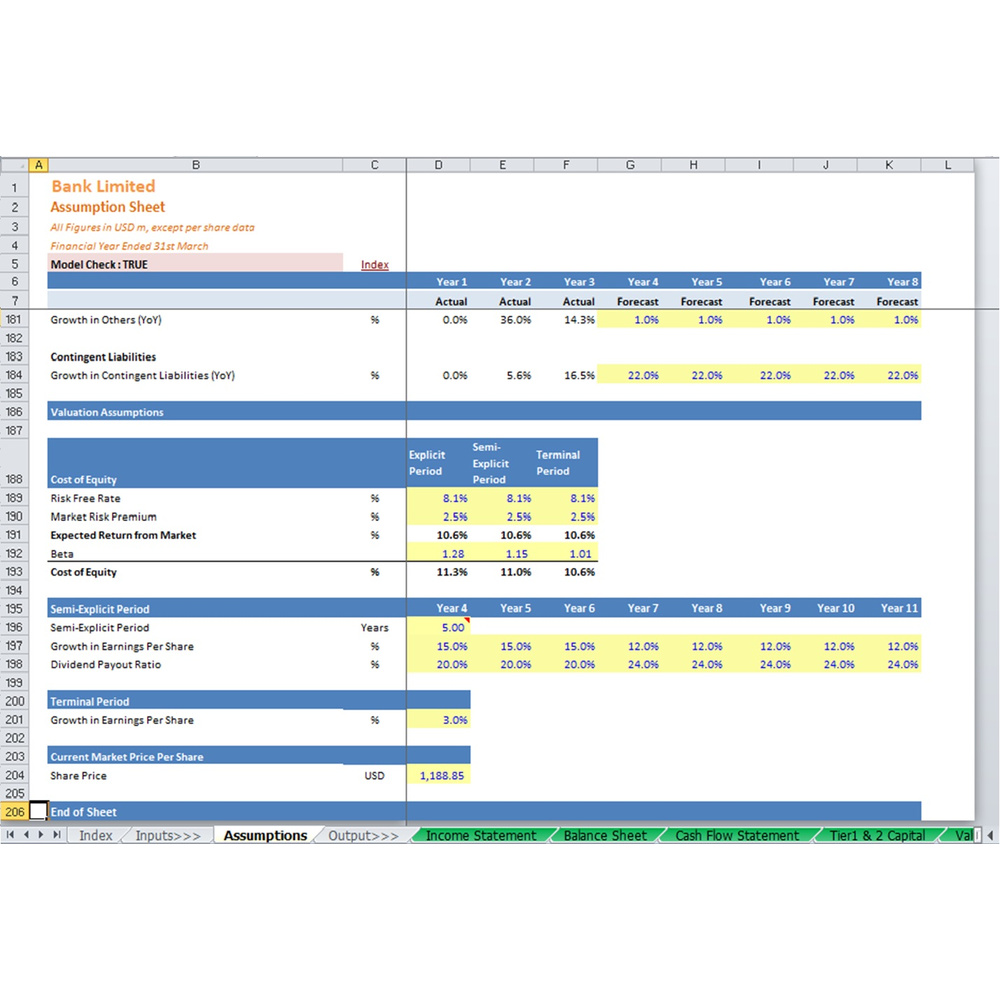
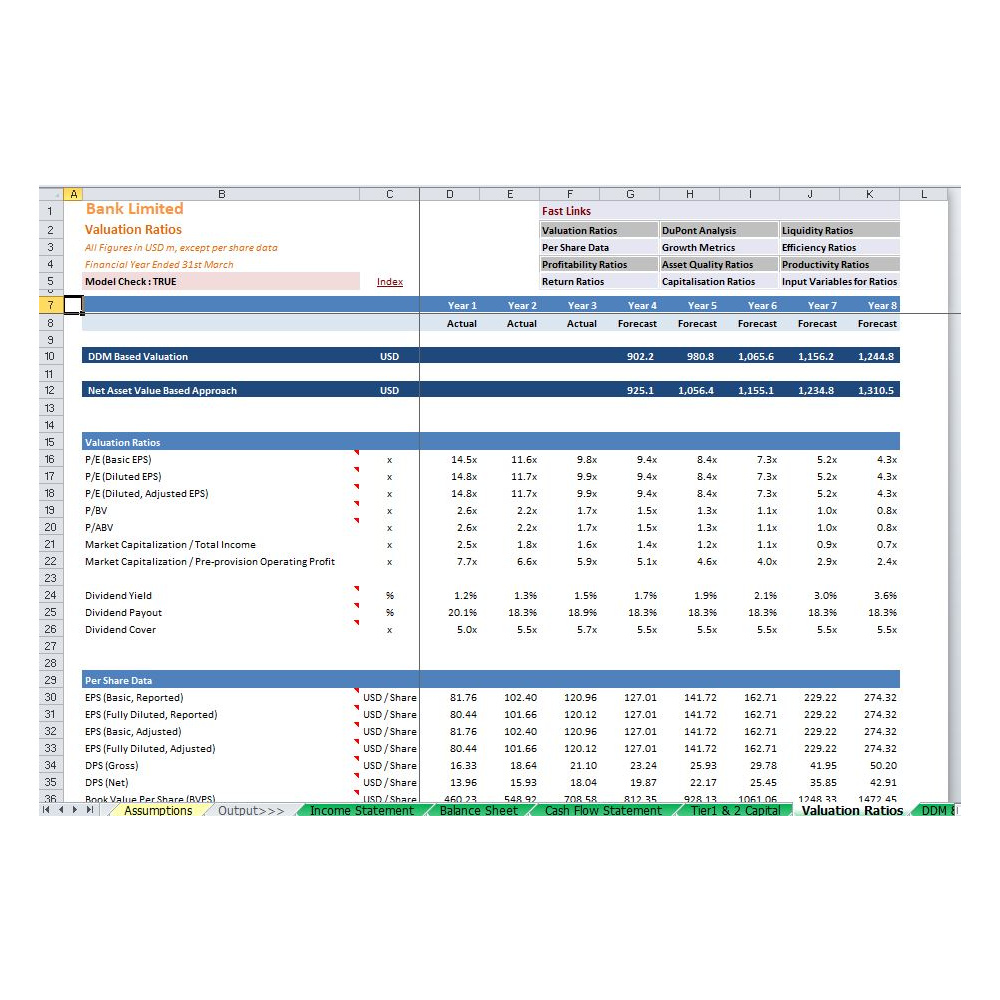
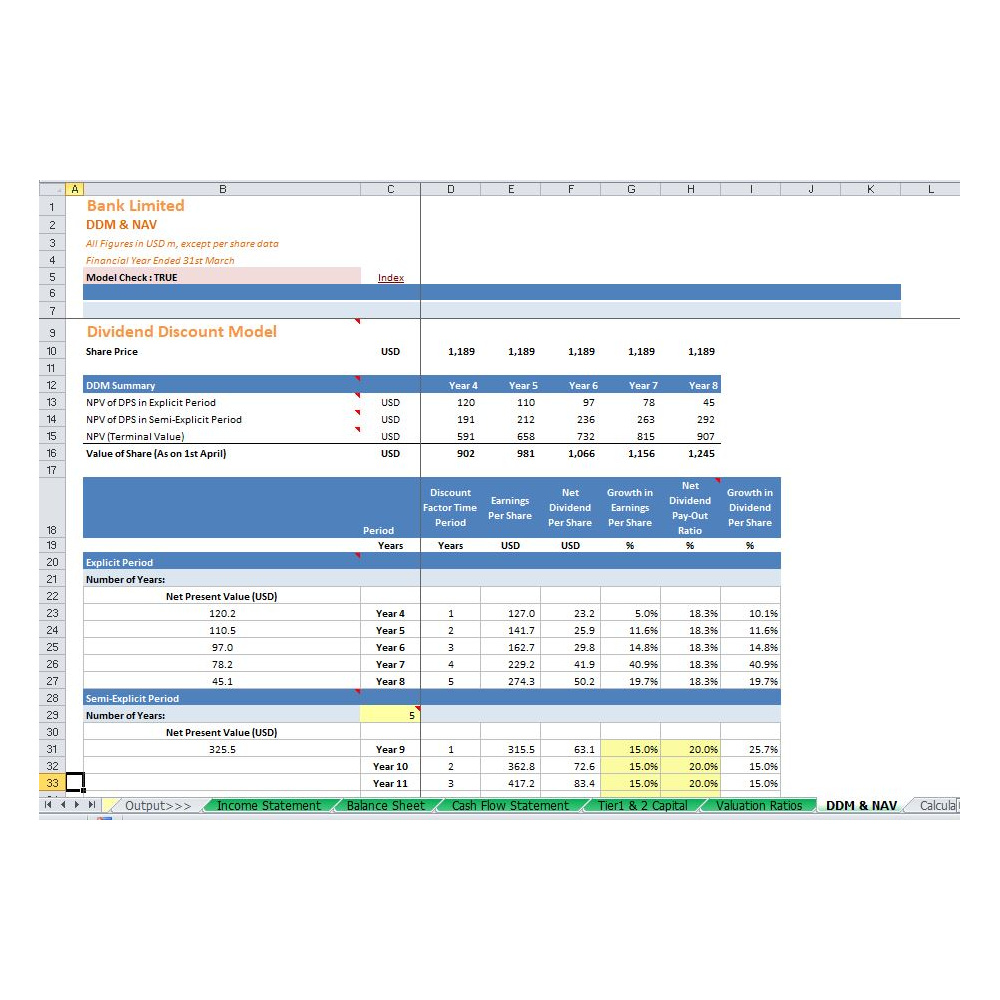
The DDM values a stock by projecting the dividends it will pay and discounting them back to present value. The logic is simple: if the value the model returns is higher than the current market price, the stock is undervalued. If it’s lower, the market is paying too much.
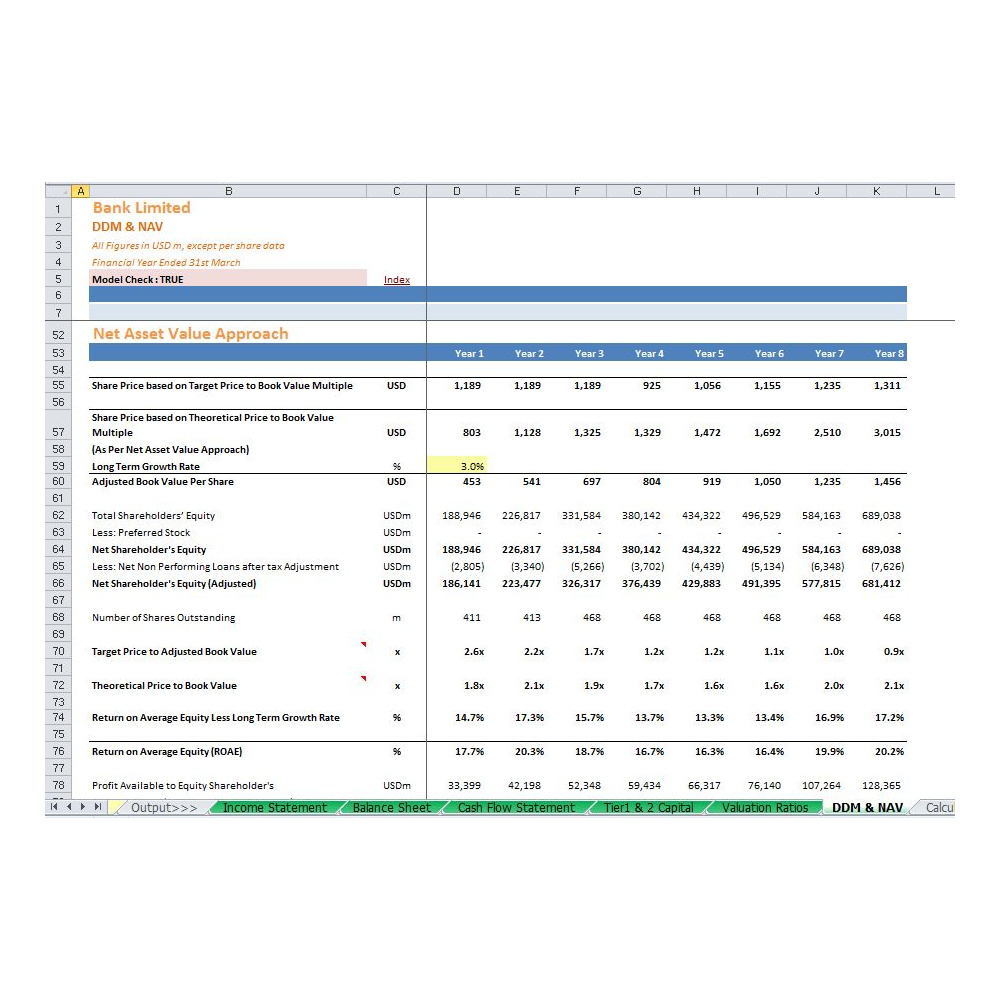
The NAV approach runs alongside it, valuing the bank on the net assets attributable to shareholders — a useful sense-check, and often the more relevant measure for banks trading below book.
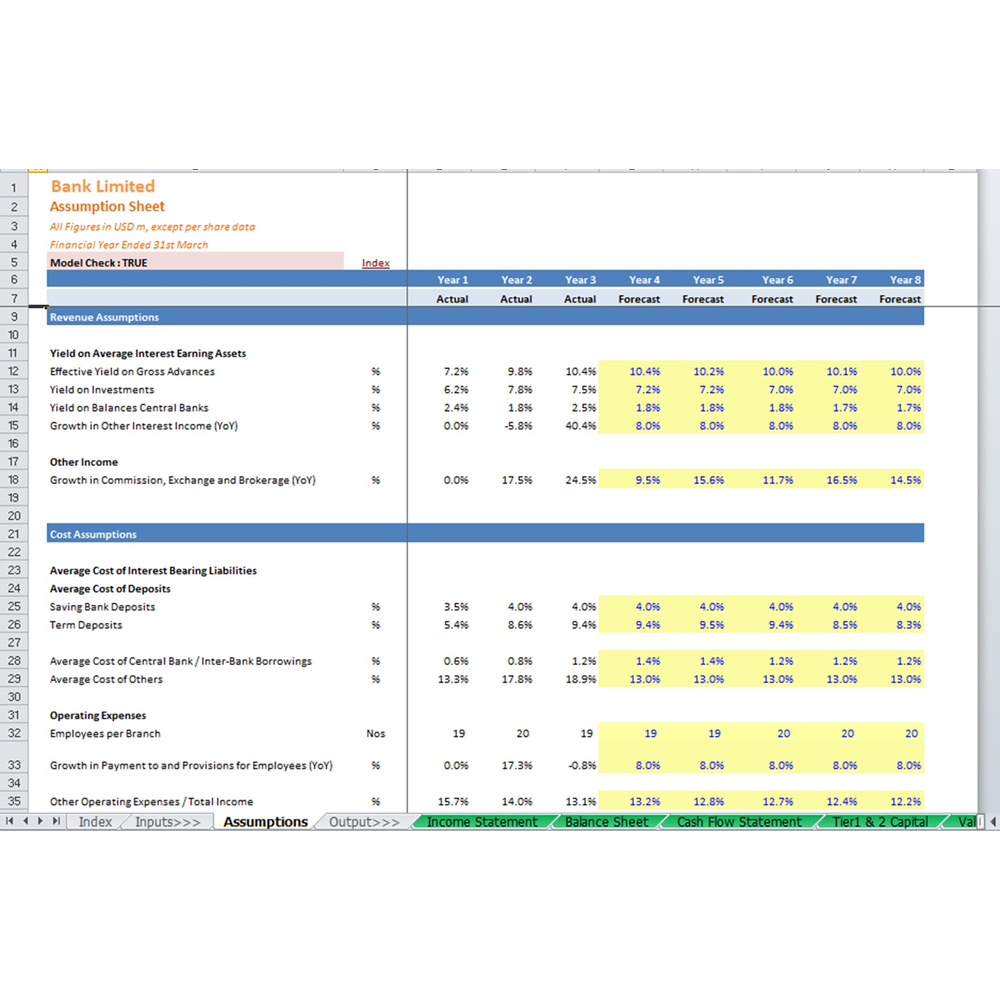
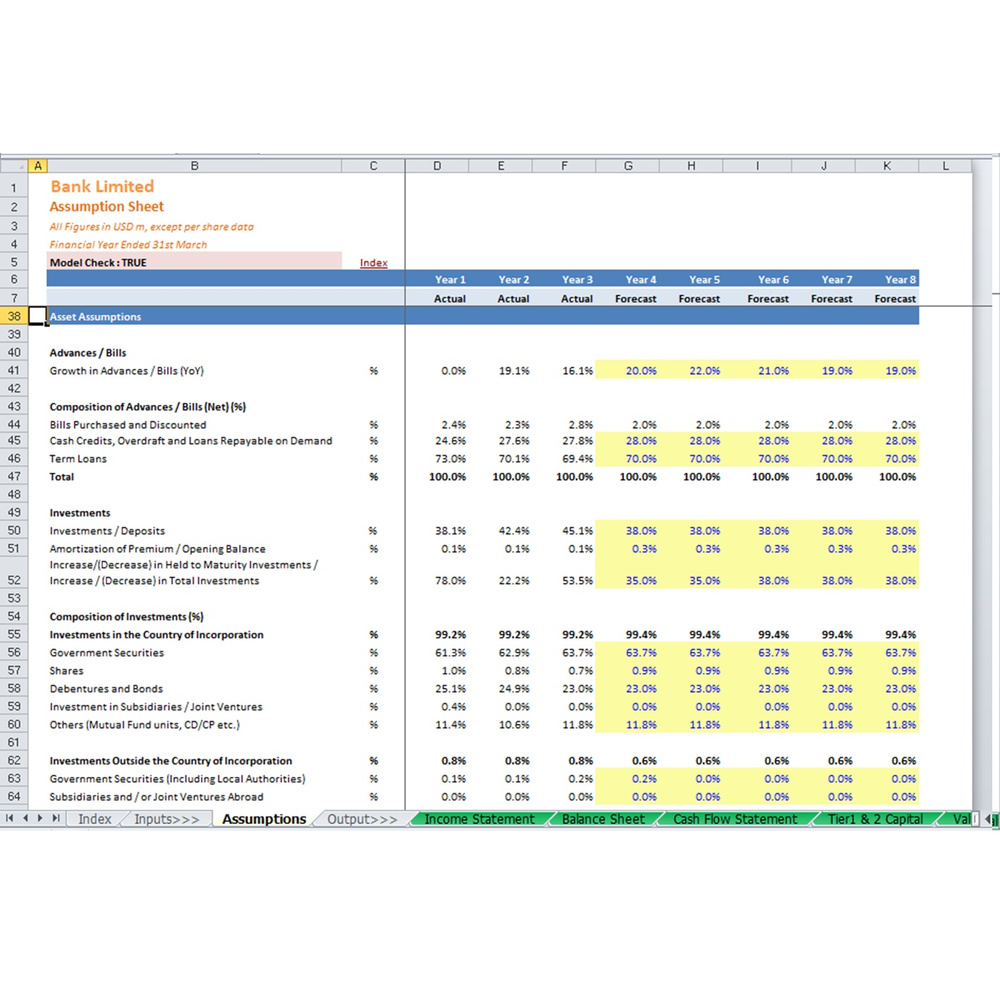
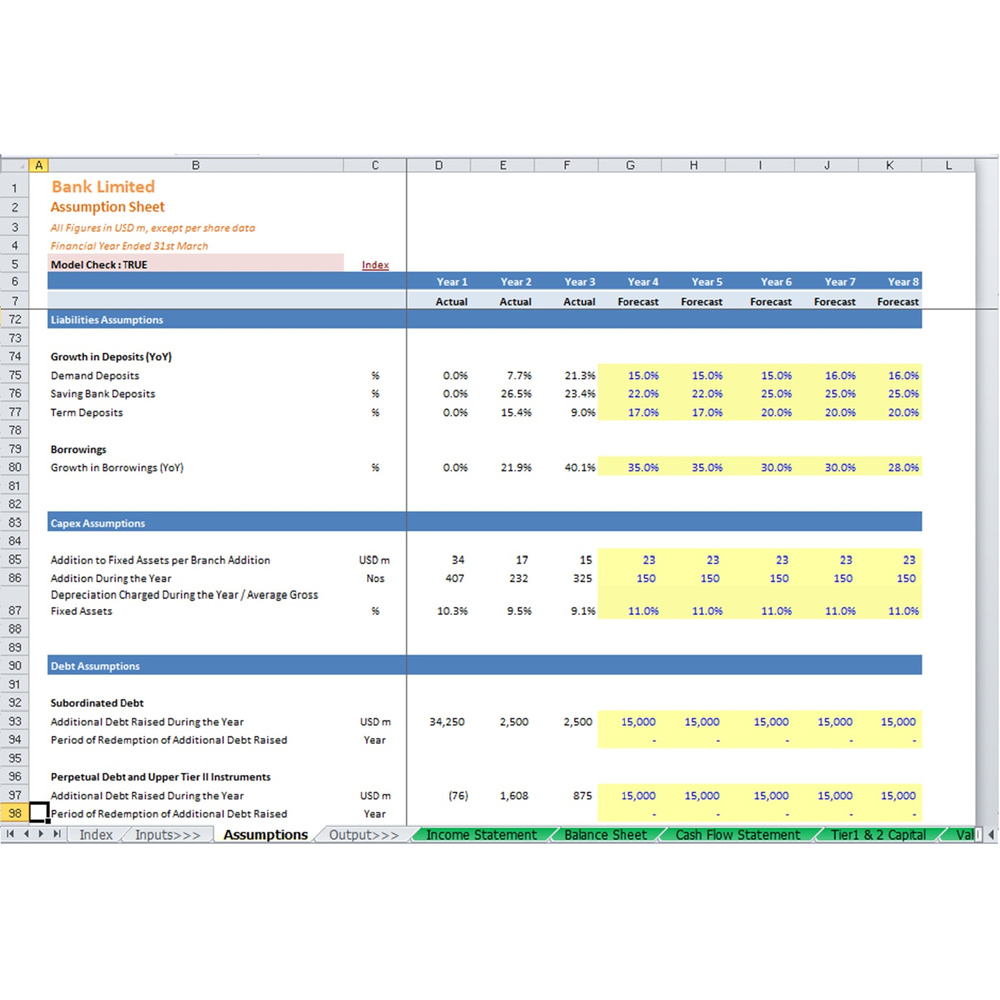
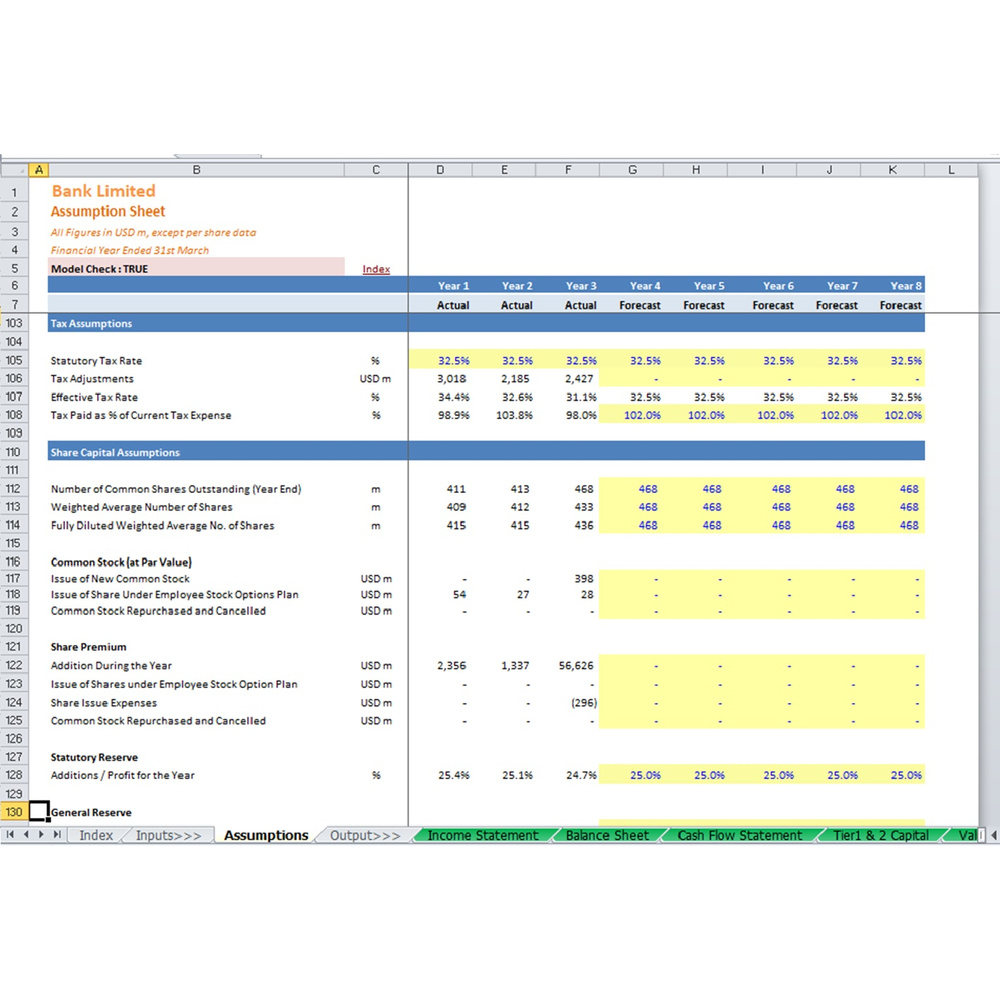
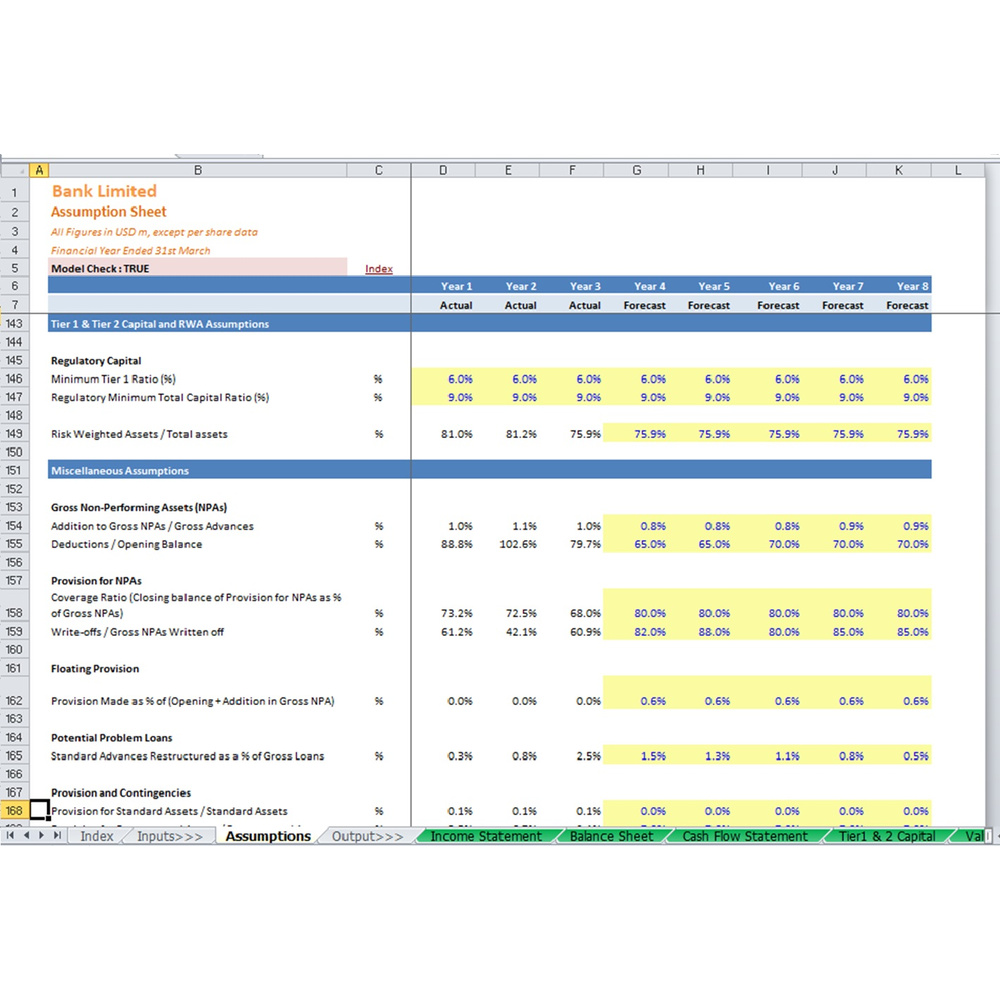
A single assumptions tab drives the entire model. Change the input and every statement, ratio, and valuation output updates. The inputs cover:
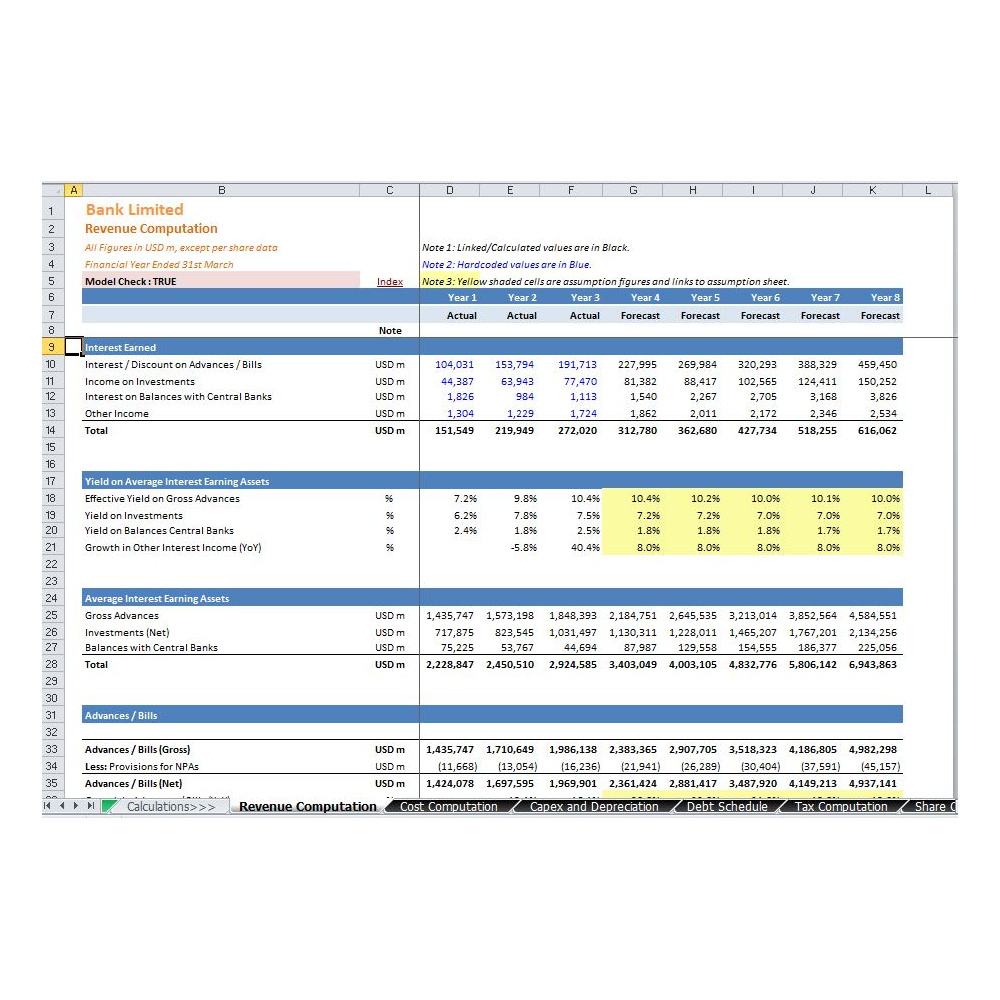
| Revenue | Effective yield on gross advances, yield on investments, gross advances, and more |
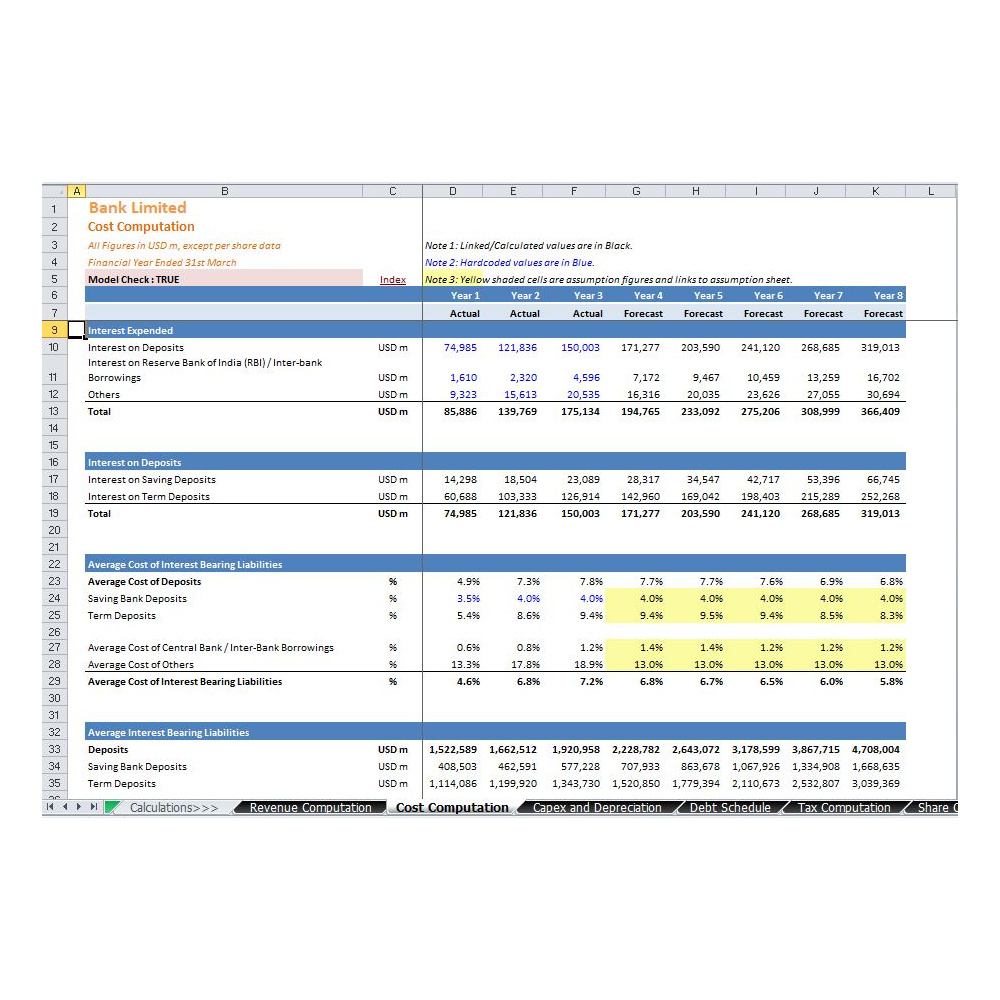
| Costs | Interest on deposits, average interest-bearing liabilities, employee cost, and more |
| Income Tax | Effective and statutory tax treatment |
| Capex & Depreciation | Tangible and intangible assets, with amortisation schedules |
| Debt | Long-term and short-term borrowings |
| Share Capital | Issue of new shares and reserve accounts |
| Dividends | Interim and final dividend, including tax impact |
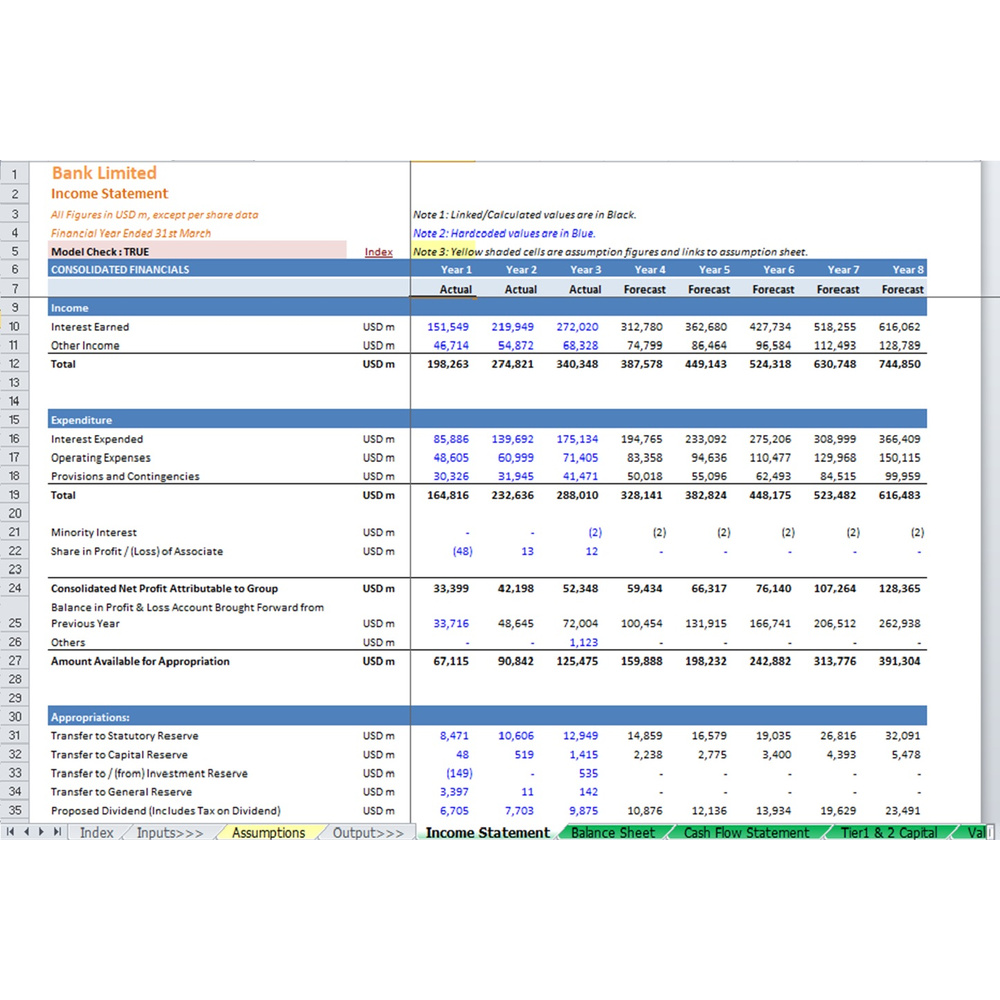
Comprehensive calculations run off your inputs to generate:
The analysis sheet goes well beyond a standard ratio pack, with metrics chosen specifically for banking:
Price-based valuation ratios, plus per-share data including EPS, DPS and FCFF per share.
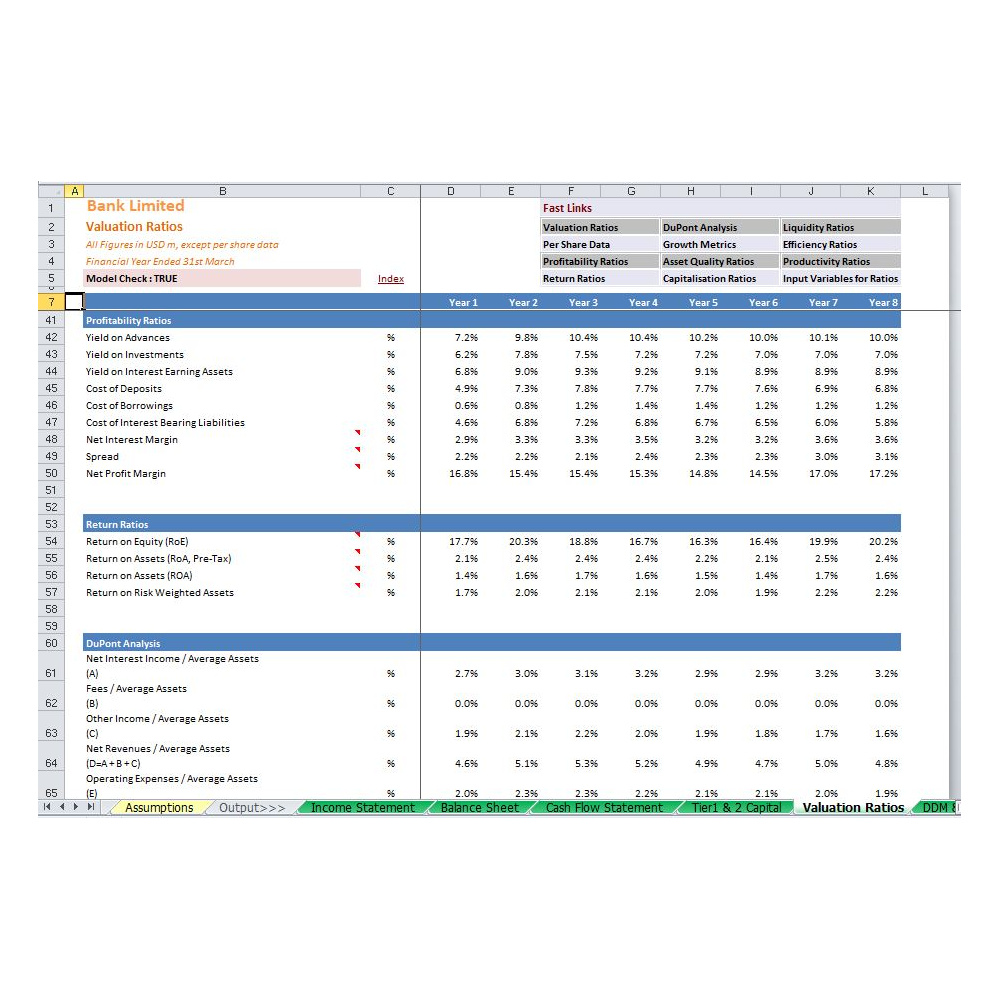
Profitability ratios, return ratios, and a full DuPont decomposition of ROE.
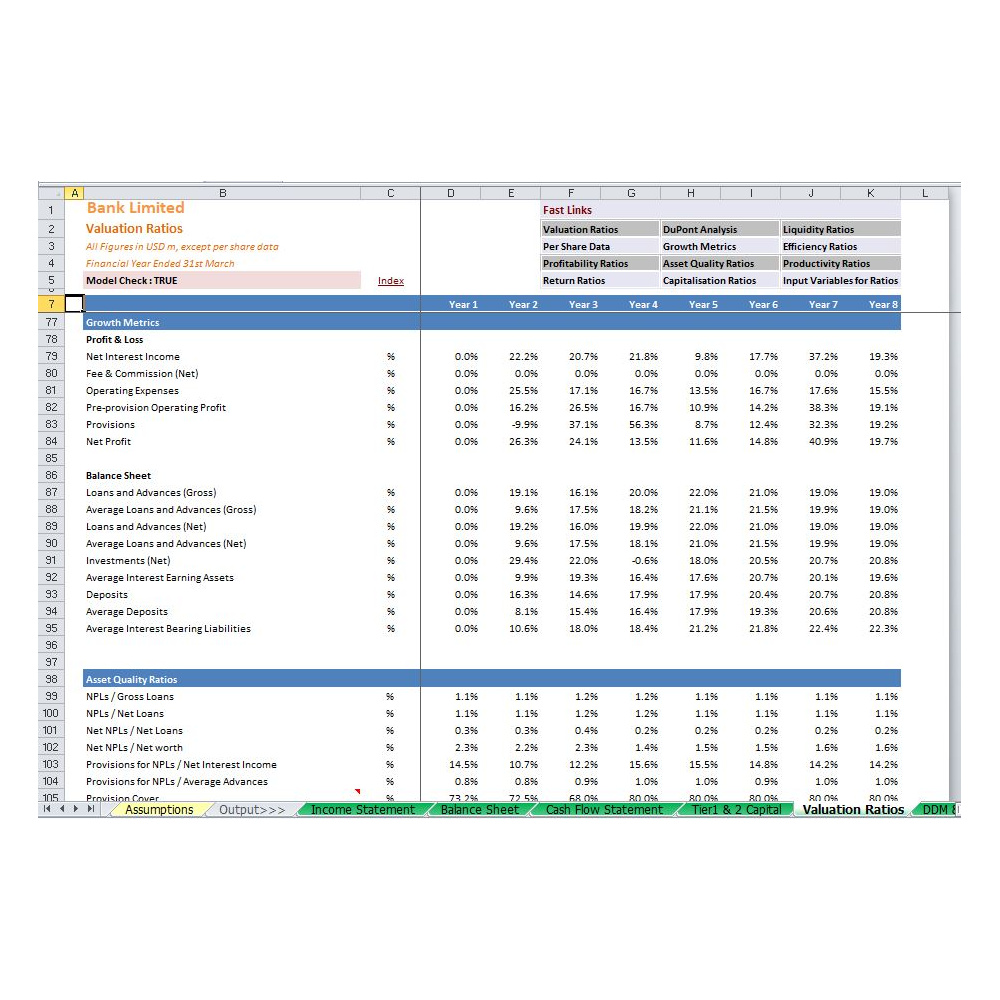
Growth matrix and asset quality metrics — critical for assessing a lending book.
Capitalisation ratios, liquidity ratios and productivity ratios.
Yield on advances, interest-bearing liabilities, asset quality, capitalisation — the drivers that actually move a bank’s value, not a generic corporate template.
DDM and NAV run in parallel, so you can triangulate rather than rely on a single number.
Every formula is visible and traceable. Change an assumption and follow it through to the valuation.
Need a model built to your own specification? See our financial advisory services or browse the full range of valuation templates.
Three years of history, a five-year forecast, DDM and NAV valuation, and a full banking ratio pack — ready to use in Excel.