$149.00
A comprehensive, institutional-grade green methanol financial model for evaluating the economic viability of producing methanol from renewable sources — green hydrogen and captured CO₂ — with project financing, capital and operating cost modules, carbon capture, LCOM and full sensitivity analysis, built in Excel.
Green methanol is one of the few credible answers to decarbonising shipping and industrial feedstock, and one of the hardest projects to build a case for. It is not a single plant but a chain of them: a biomass and CO₂ unit, a hydrogen production unit, a methanol synthesis unit and battery storage, each with its own capital cost and each feeding the next. Get the interaction between them wrong and the entire economics of the project fall apart.
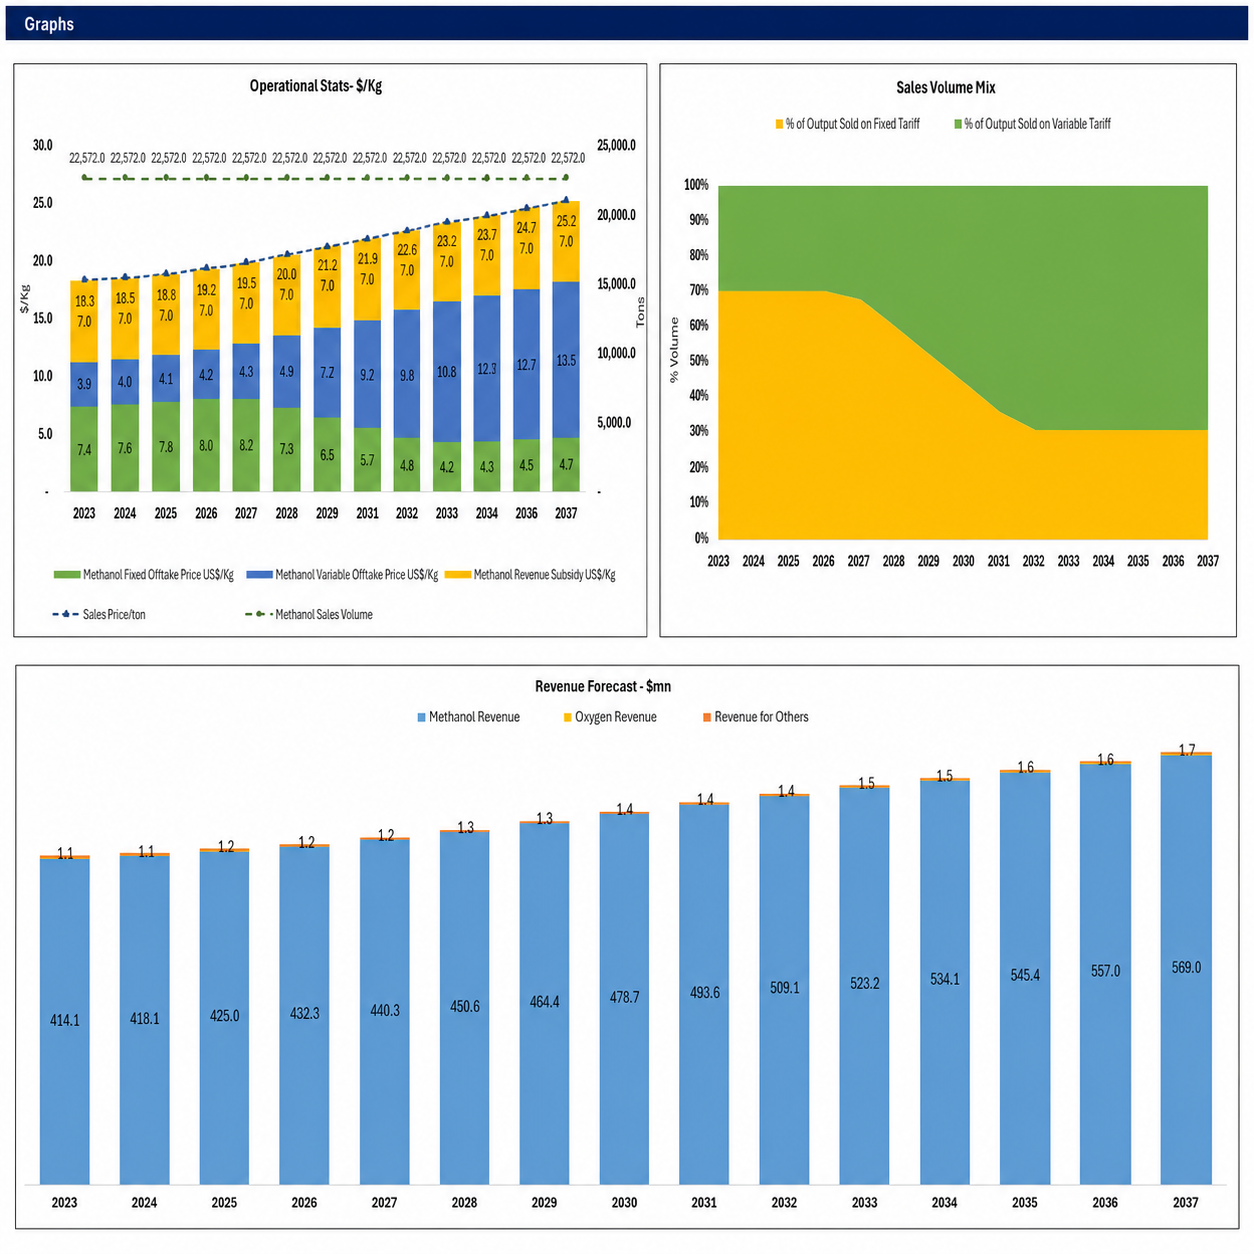
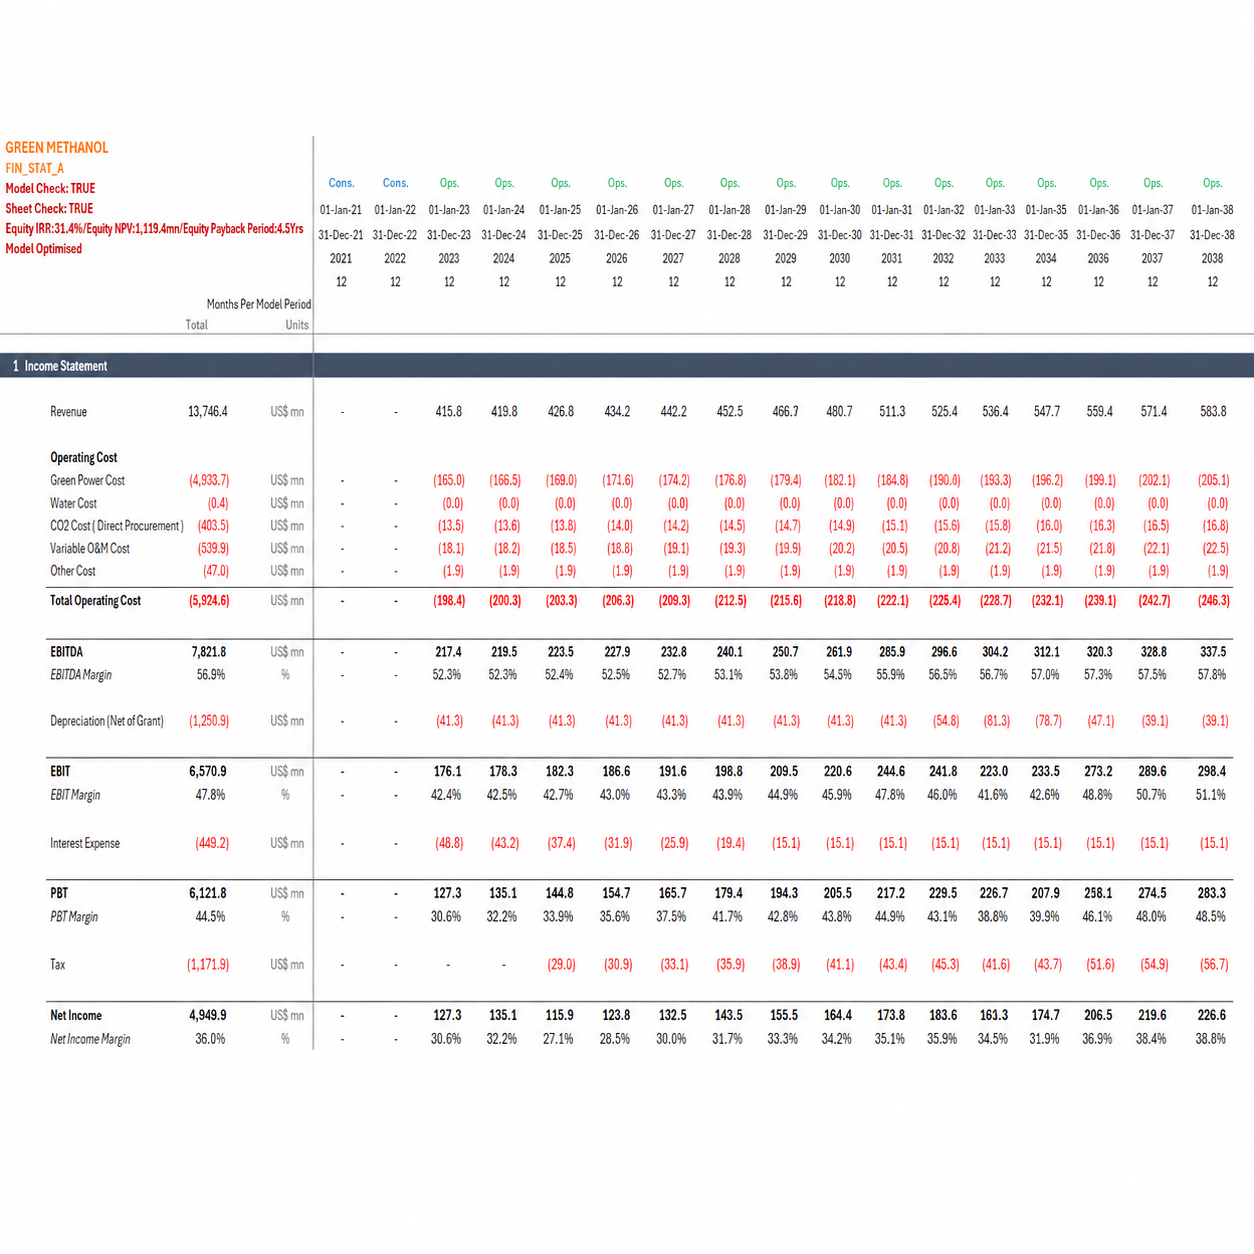
This green methanol financial model was built to hold that complexity properly. Capital expenditure is broken down unit by unit, production is modelled with degradation and seasonality factors, and revenue accounts for both feed-in tariff and merchant pricing — so investors and developers can assess project returns, funding requirements and long-term sustainability from a single integrated file.
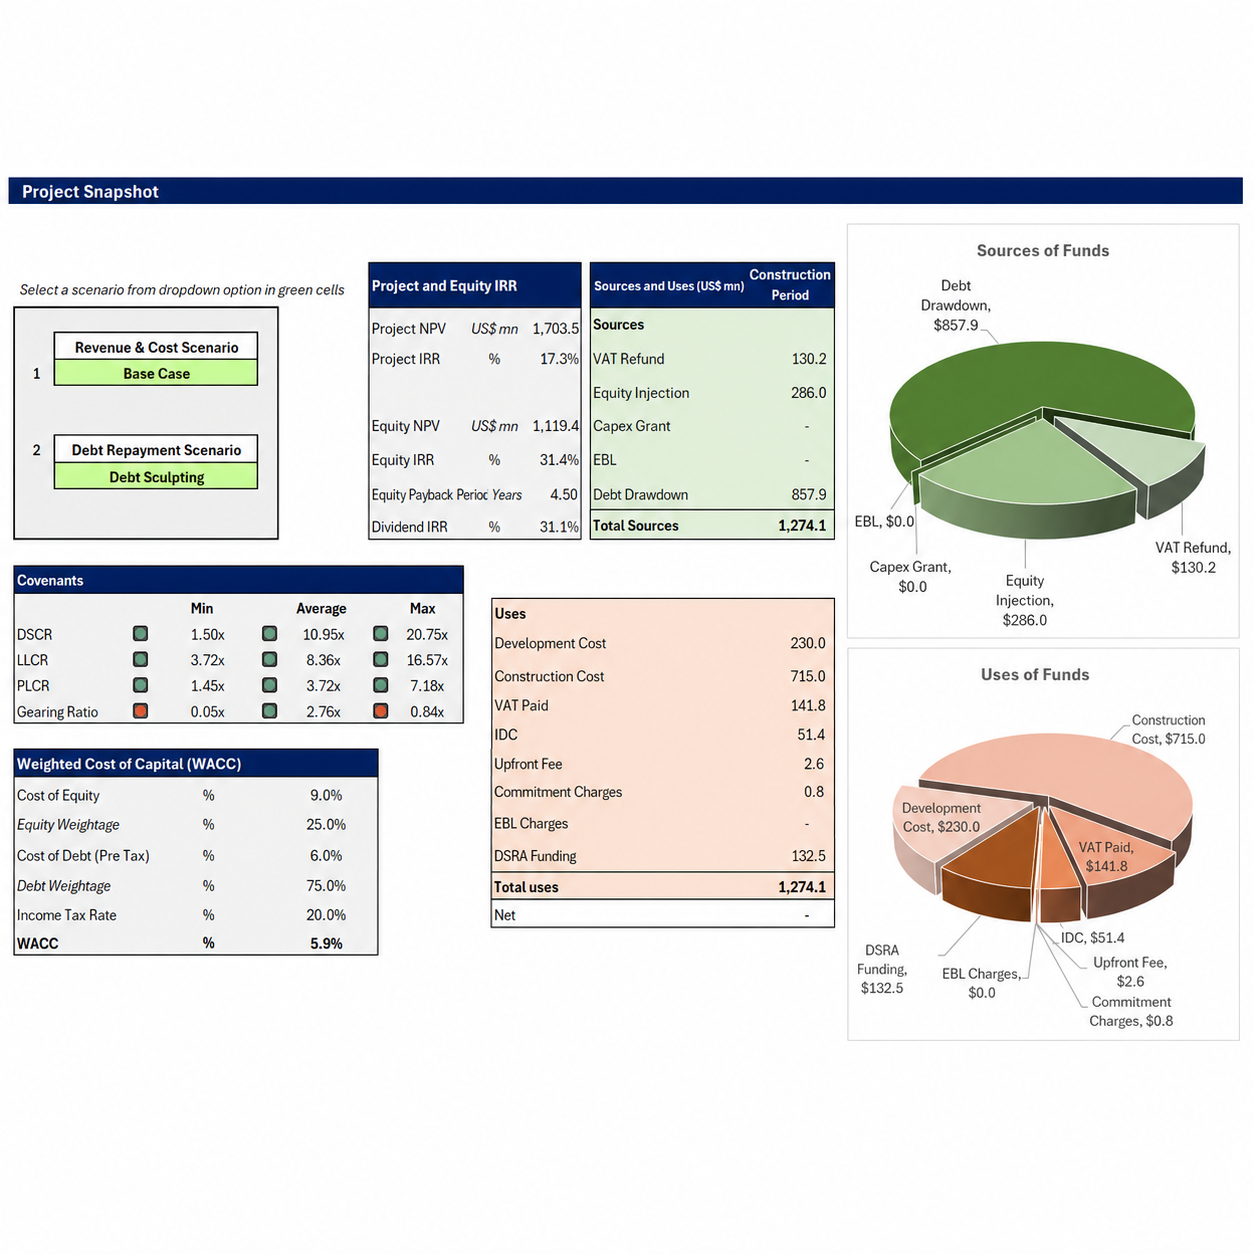
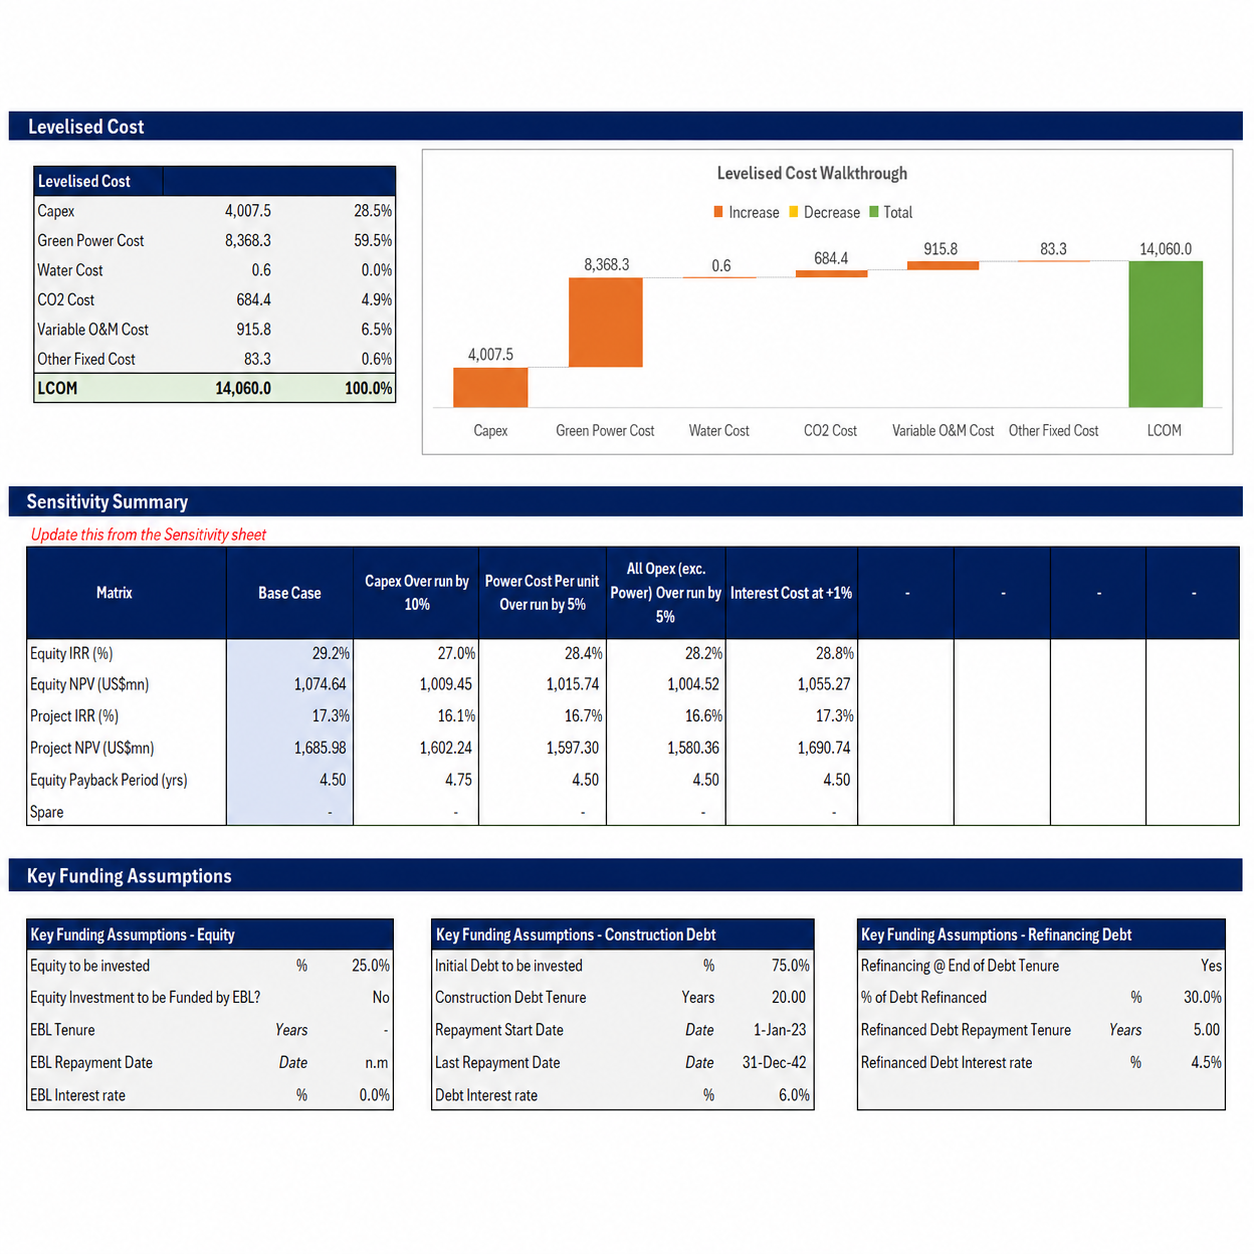
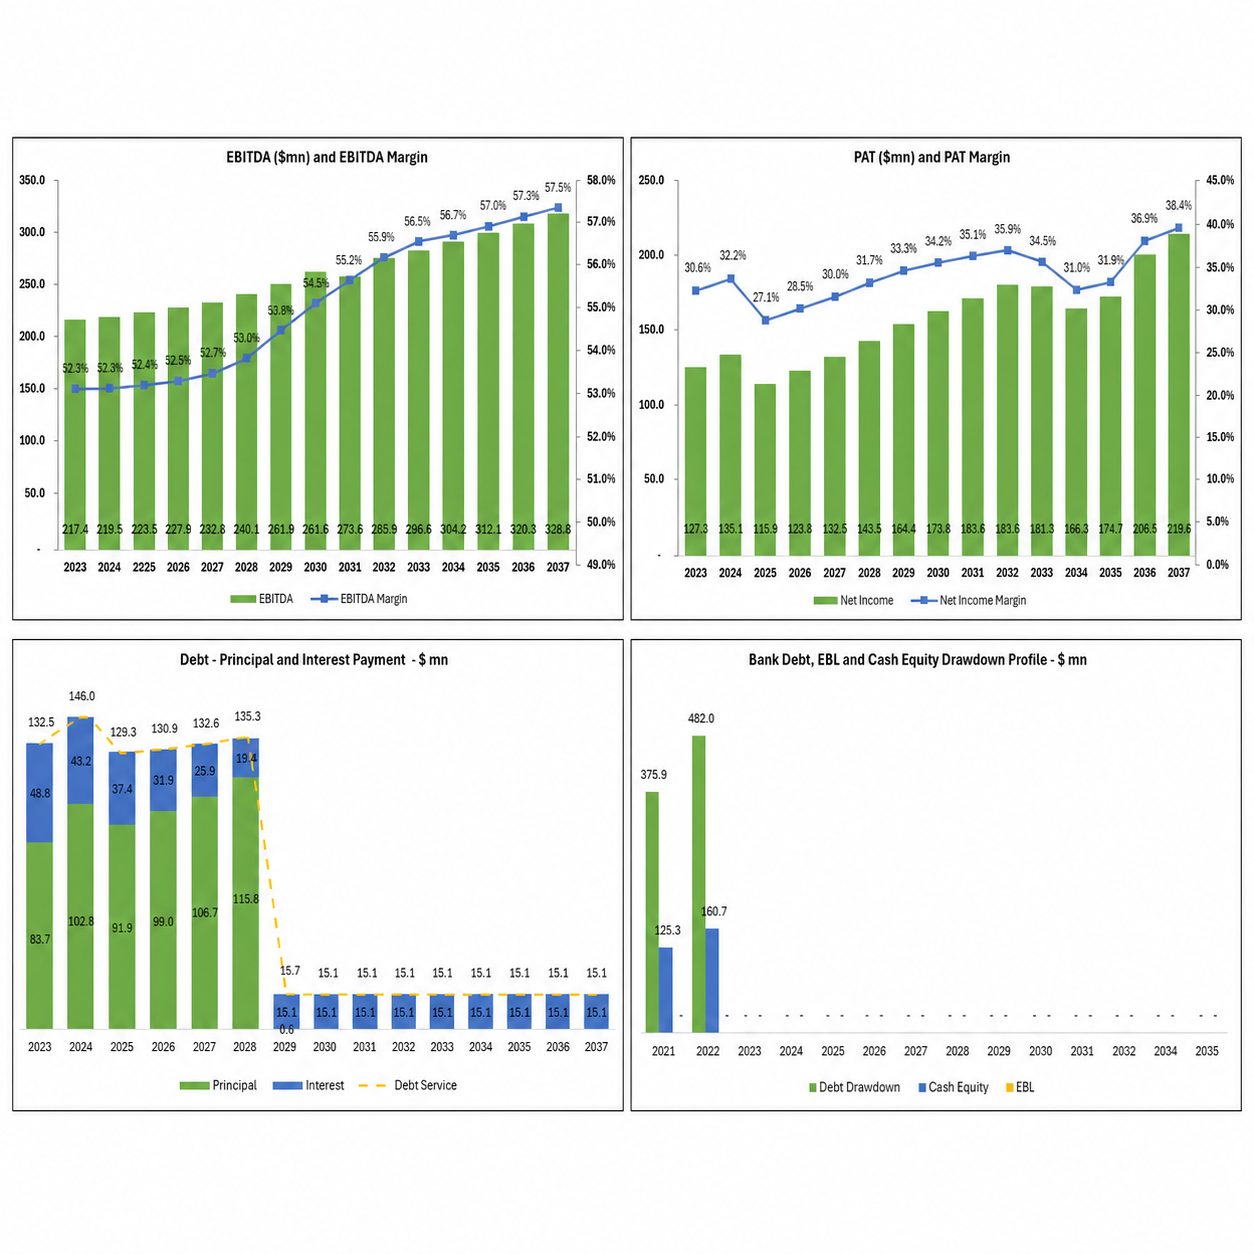
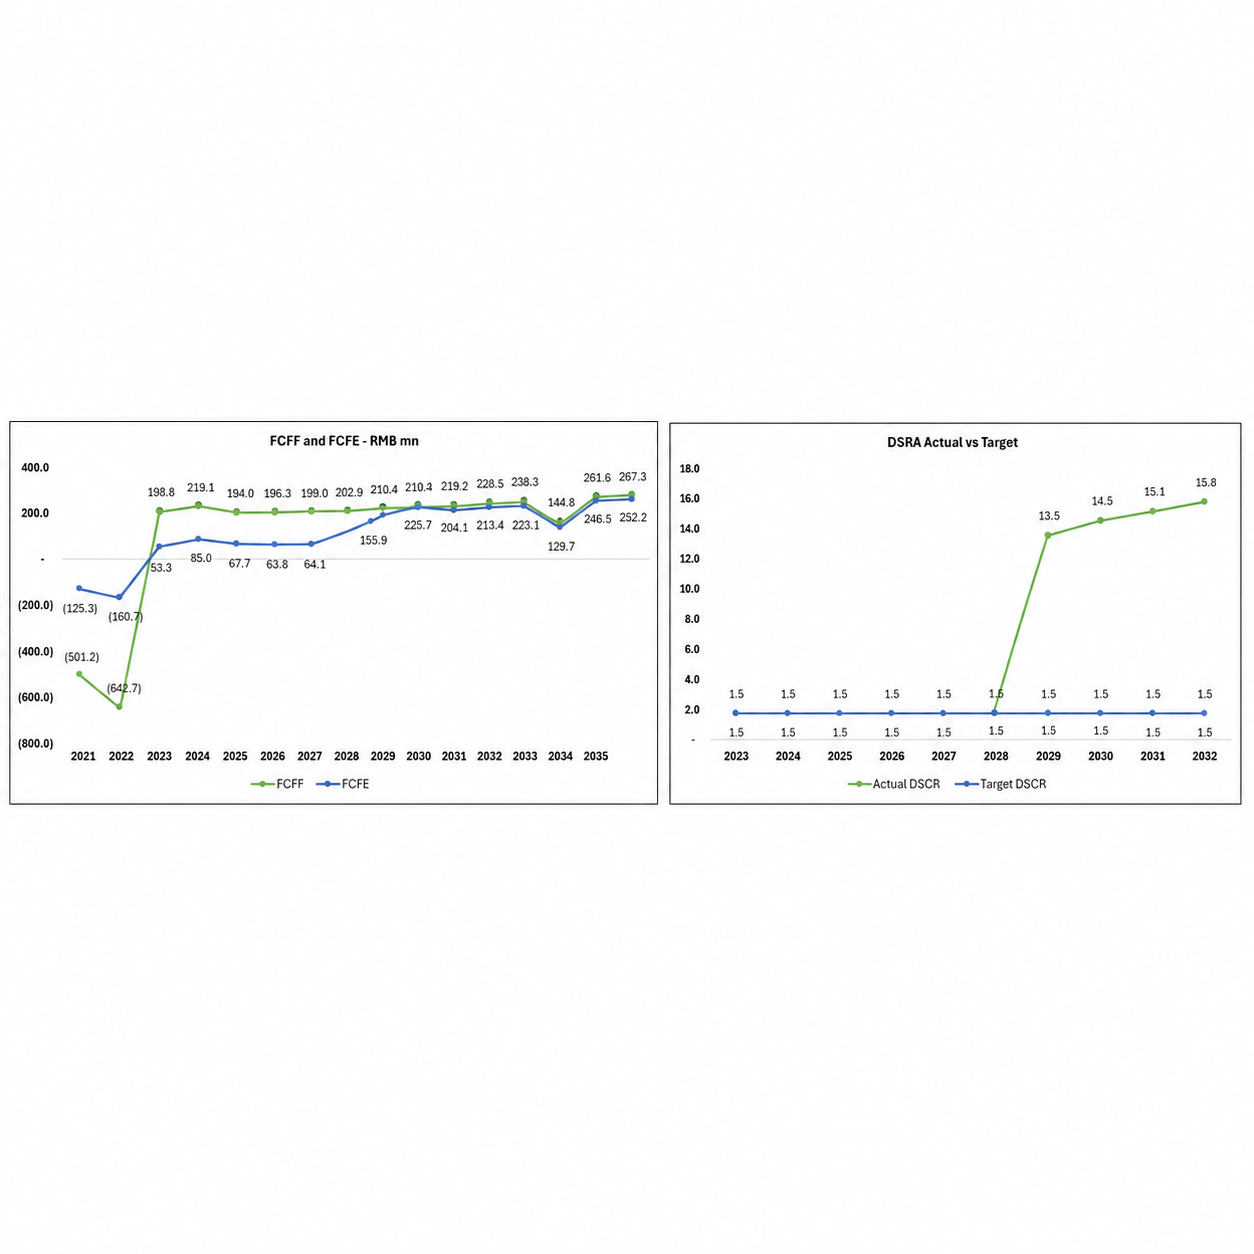
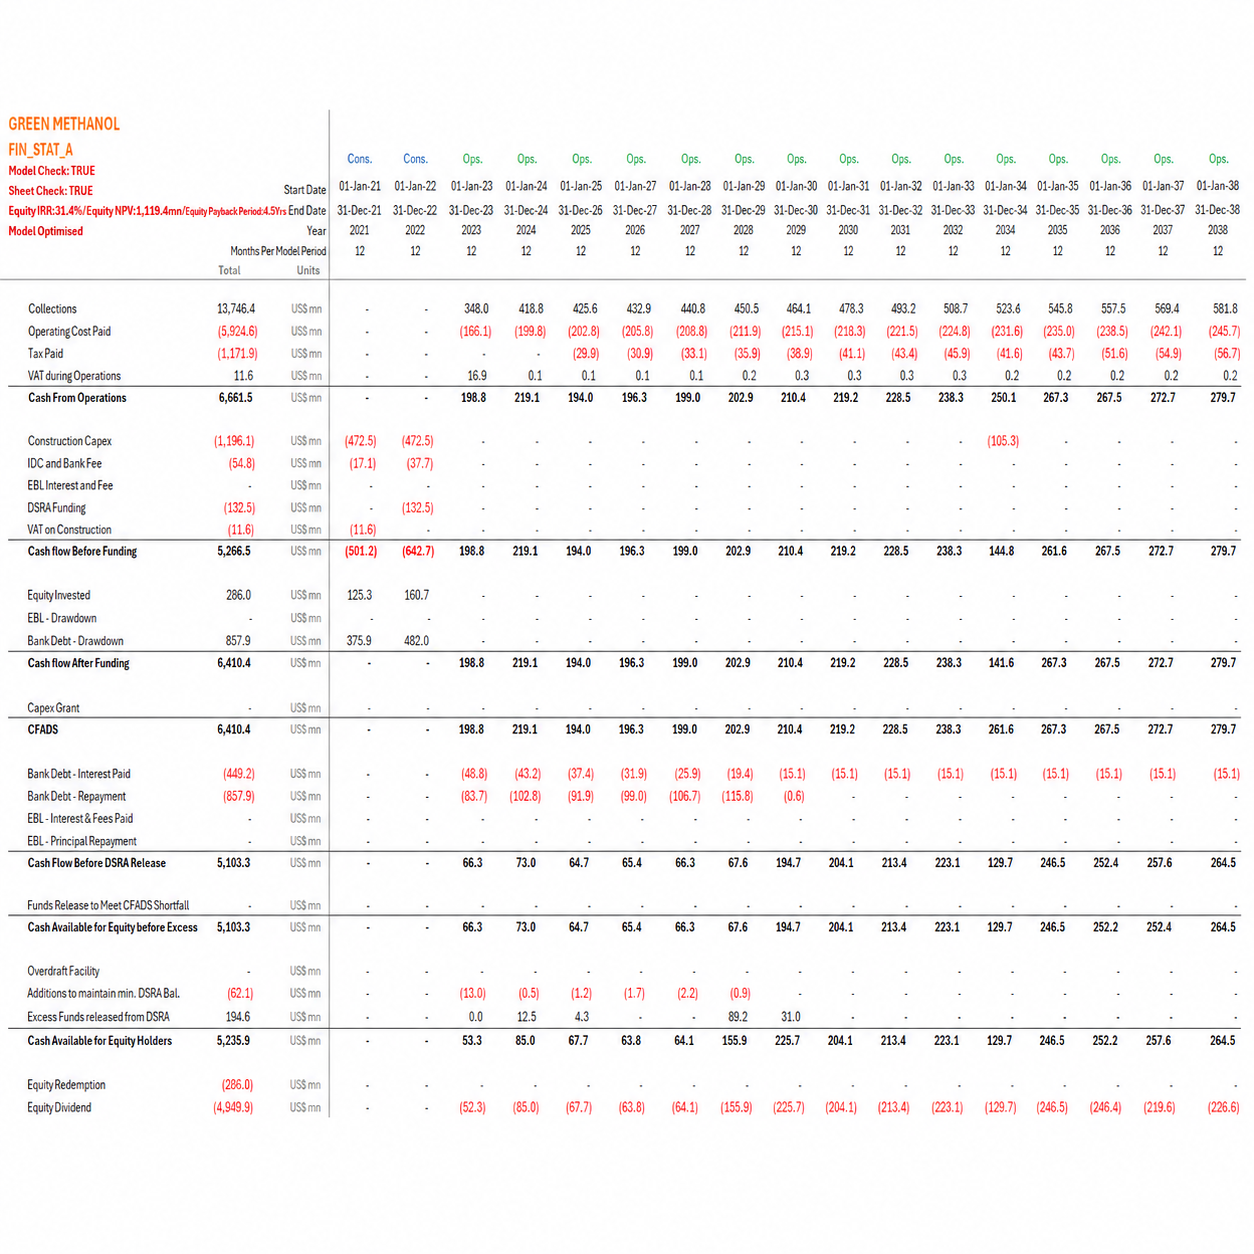
Alongside the standard project finance suite — Project and Equity IRR and NPV, minimum and average DSCR, LLCR, PLCR, equity payback, a full cash waterfall and VBA-driven sensitivity analysis — the model calculates the Levelised Cost of Methanol (LCOM), the benchmark figure the entire e-fuel market is judged against.
Returns tell you whether a project is worth building. The levelised cost tells you whether it can survive in the market. By spreading total lifetime cost across total lifetime output, LCOM gives you a single per-tonne figure to set against the prevailing methanol price — and, critically, against the fossil-derived methanol your product has to displace.
That comparison is the central question in green methanol. The green premium is real, and knowing its precise size is what allows you to structure around it — through offtake contracts, carbon pricing, subsidy support or scale. Because this green methanol financial model derives LCOM from the same assumption set that drives the cash flows, you can watch it respond as you flex hydrogen cost, plant utilisation or capital expenditure.
Capital expenditure is split across the biomass and CO₂ unit, the methanol production unit, the hydrogen production unit and the battery storage system. That separation is what makes the model genuinely useful. You can see which unit consumes the capital, which drives the returns, and how a cost overrun in one propagates through the whole structure and into LCOM.
Production is modelled with equal care. Methanol and hydrogen volumes, oxygen production as a by-product, a degradation factor for output decline over time, and seasonality — all explicit inputs. That last pair matters more than most templates acknowledge: a plant that quietly loses efficiency each year, or produces unevenly across seasons, looks very different in year fifteen than a flat-line forecast suggests.
Every driver of viability is an explicit, editable input. The assumptions cover:
| Capital Expenditure | Broken down by biomass and CO₂ unit, methanol production unit, hydrogen production unit and battery storage system |
| Production Profile | Methanol and hydrogen output, oxygen production, degradation factor and production seasonality |
| Revenue | Feed-in tariff (FiT), merchant price and other sources of revenue |
| Variable O&M | Cost per tonne across eight subheads — staff, electricity, consumables, transport, fuel and more |
| Fixed Costs | SPV cost, insurance, land lease, community payment, management fee and more |
| Funding Profile | Cash equity, bridge loan, bank debt, DSRA and bank overdraft |
| Debt Repayment | Annuity, sculpted and even-principal options |
| Adjustments | Inflation and indexation, VAT during construction and operations, depreciation options and working capital |
This is where the green methanol financial model earns its keep — resolving your assumptions into the full set of metrics a financing decision turns on:
Green methanol projects live or die on variables nobody can forecast with confidence — the methanol price, the cost of energy, and how much of your output is actually contracted. This model includes VBA-driven sensitivity analysis across exactly those inputs, so instead of arguing about a single point estimate you can present a range and show precisely where the project stops working.
That capability matters most in the room where funding is decided. A lender who can see how DSCR and LCOM behave at a twenty percent lower methanol price is far better placed to lend than one looking at a base case alone.
The model separates construction and operation cleanly, and lets you set the length and granularity of each — monthly, quarterly, semi-annual or annual — independently. Every revenue and cost assumption can be entered across three scenarios and switched at a button. The debt funding drawdown carries three scenarios of its own, valuable when negotiating terms with financial institutions, and repayment can be profiled as annuity, even-principal or sculpted.
The levelised cost per tonne comes straight from the model, so you can benchmark against fossil methanol and market pricing instantly.
Four units modelled separately, so you can see where the capital goes and how an overrun in one affects the whole.
Output decline and seasonal variation are explicit inputs, giving a far more honest long-run production profile.
New to these metrics? Read an overview of the debt service coverage ratio. For a model built to your own specification, see our project finance advisory services, or browse the full range of PPP and project finance templates.
Capex by production unit, LCOM, degradation and seasonality, VBA sensitivity analysis and every lender metric from Project IRR to LLCR — ready in Excel.