$149.00
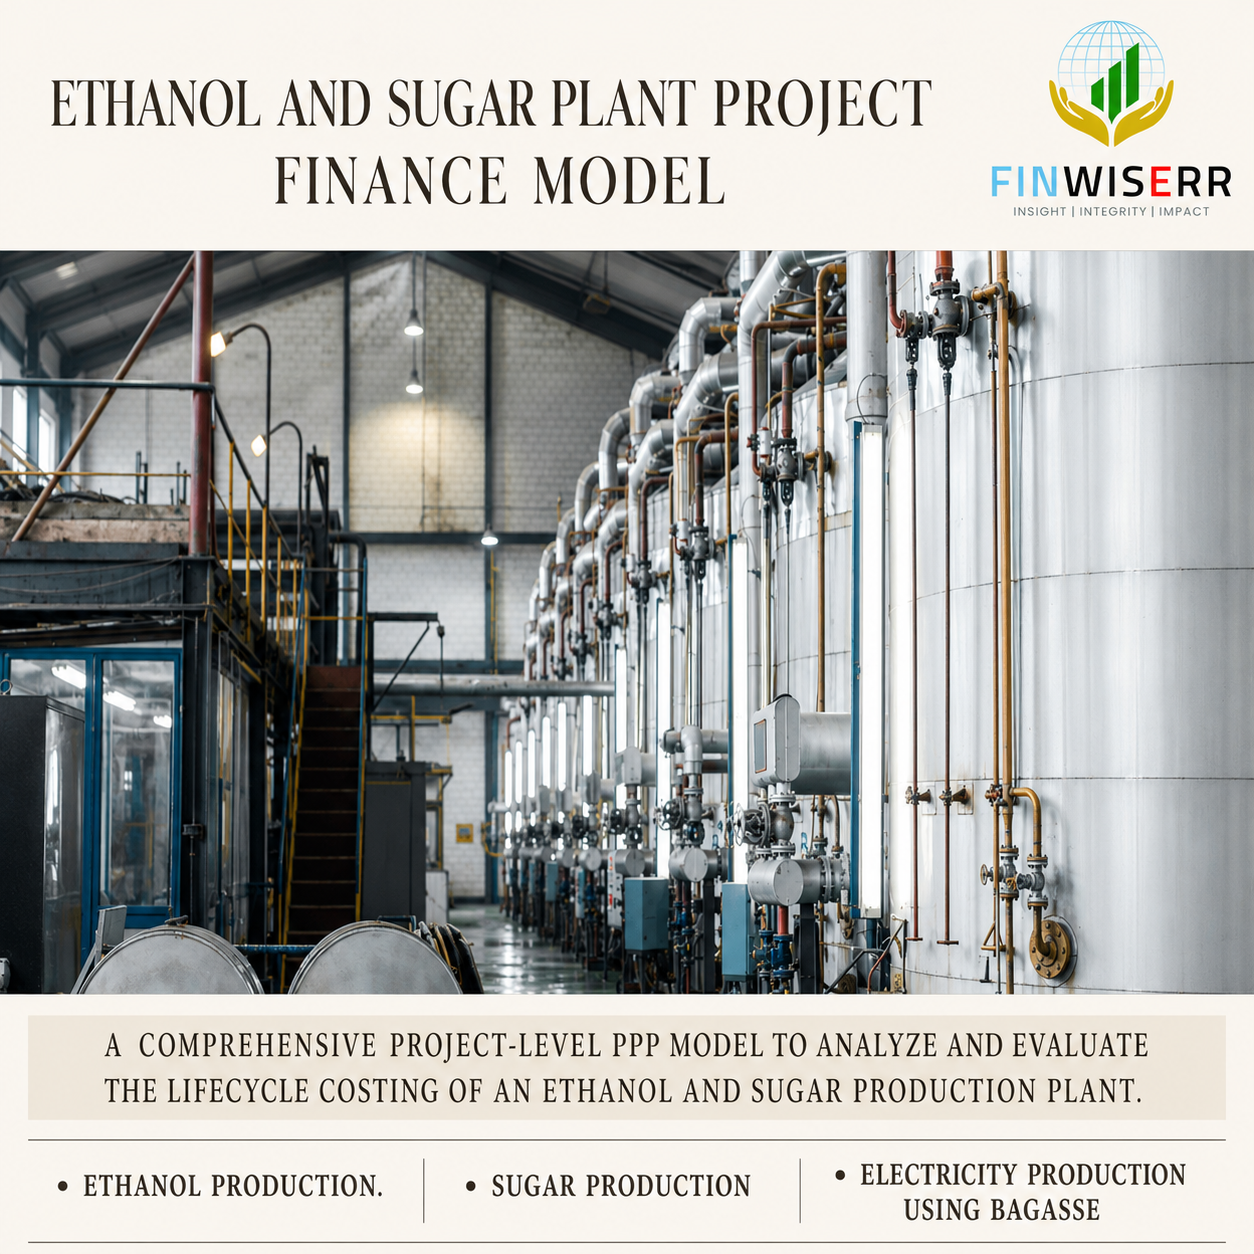
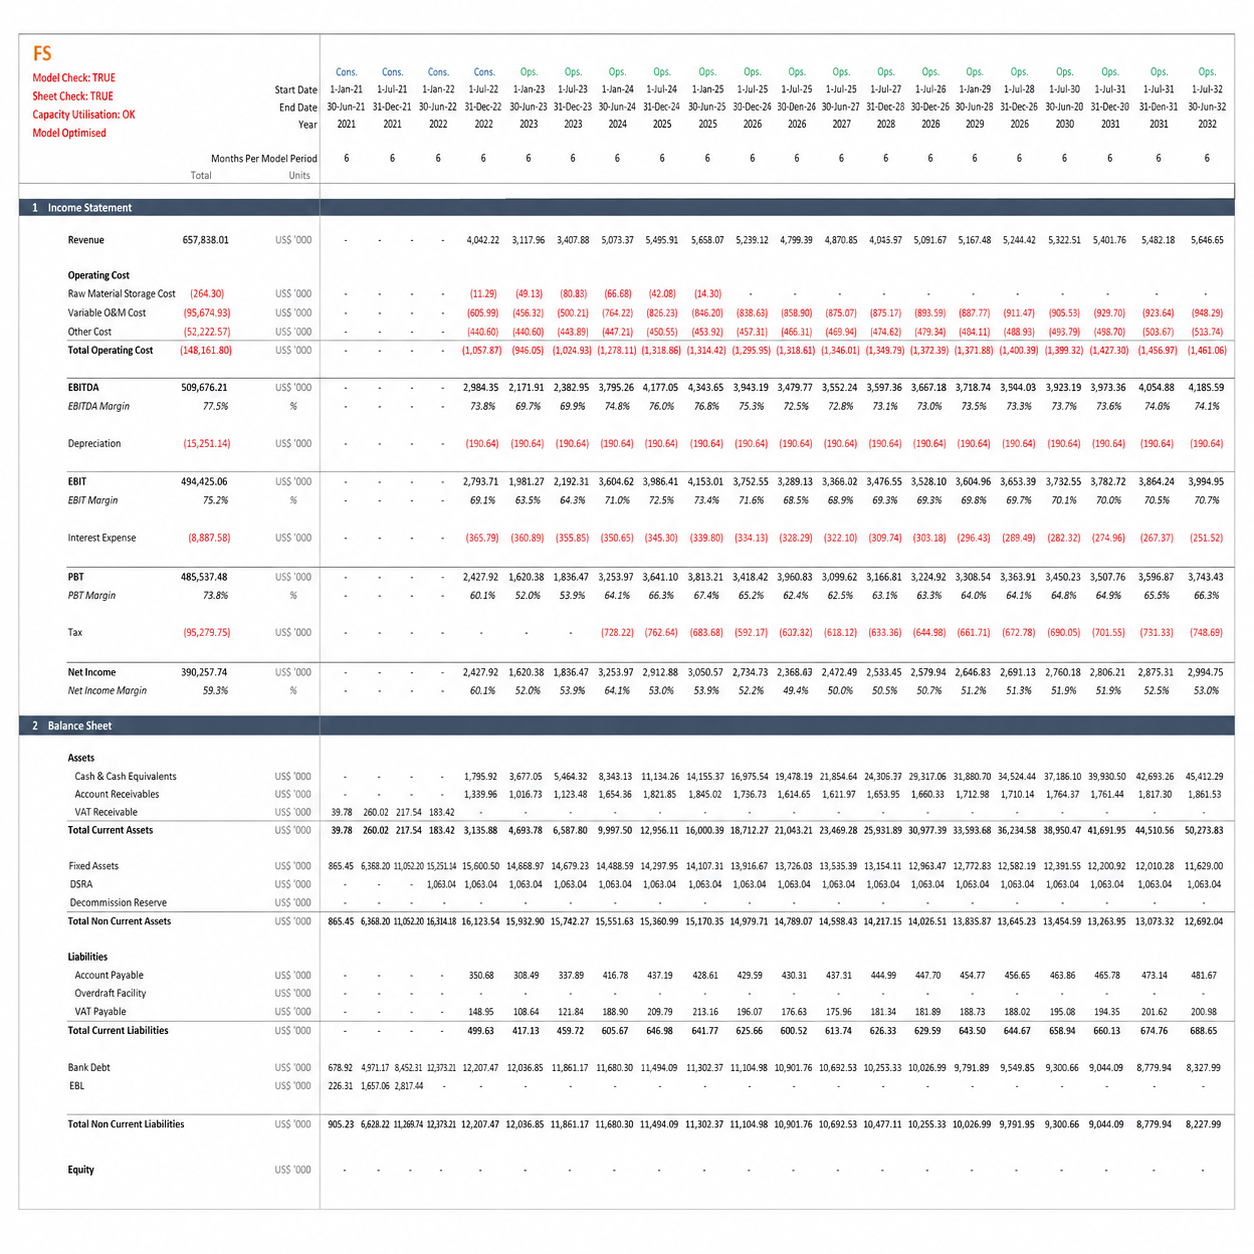
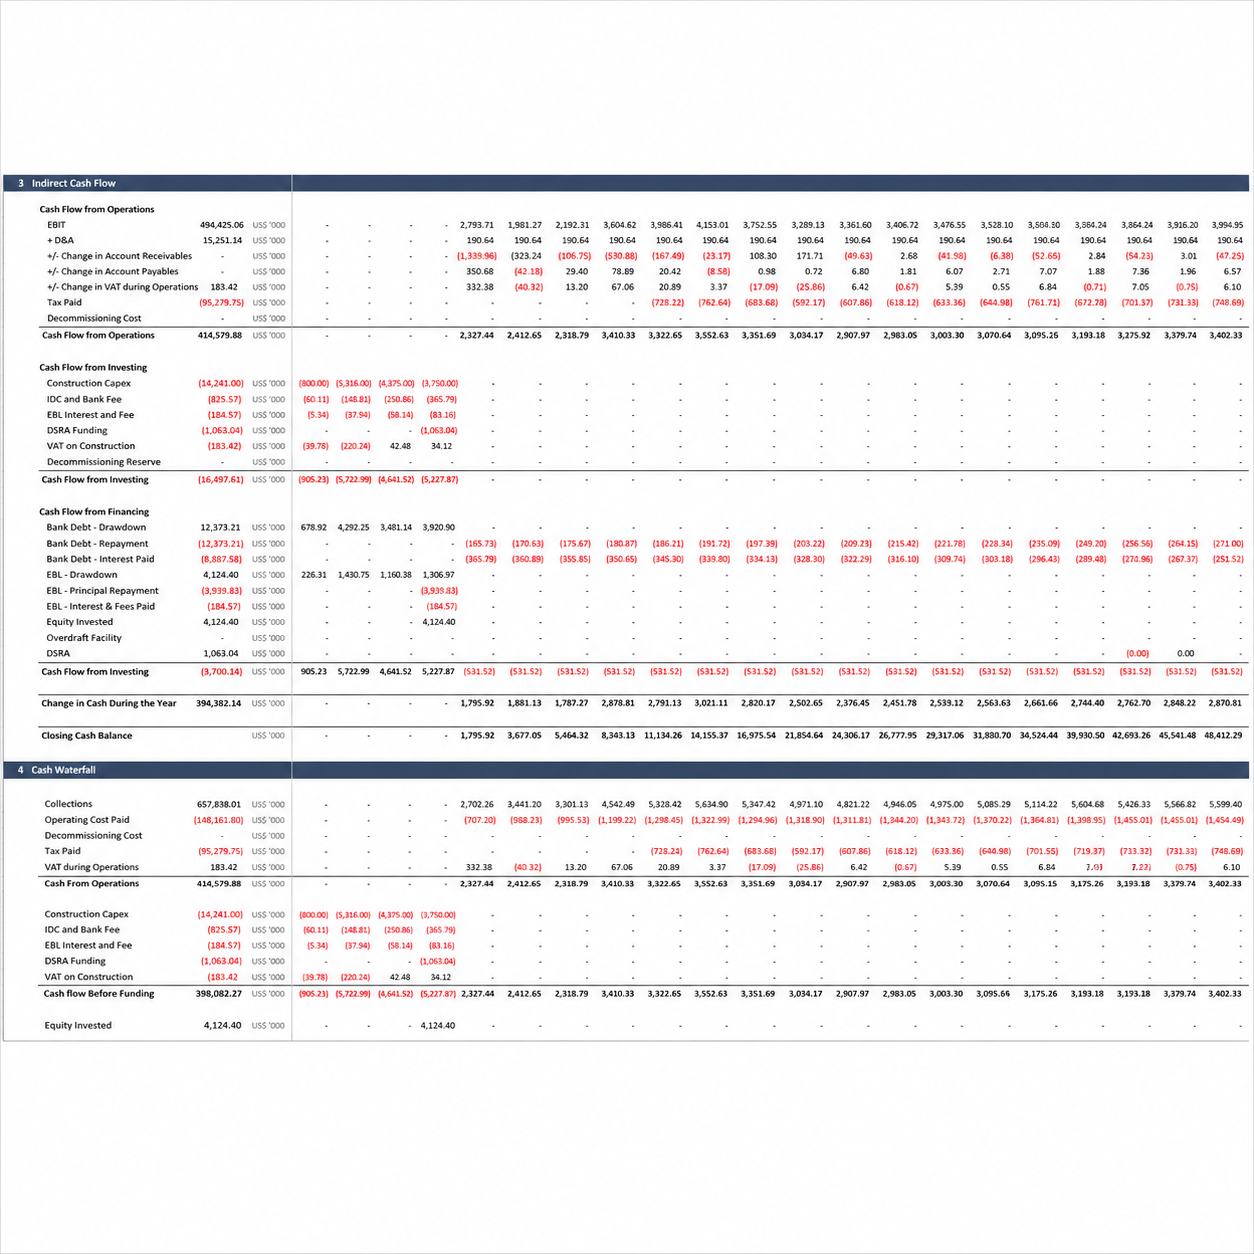
A detailed, institutional-grade ethanol plant financial model for an integrated ethanol, sugar and onsite power project, covering construction, operation and financing across a fully flexible timeline — with three integrated statements, a cash waterfall and complete lender metrics, built in Excel.
An ethanol and sugar plant is really three businesses sharing one feedstock. Sugarcane comes in, and out the other side come ethanol, sugar and — from the bagasse left behind — electricity that can be sold to third parties. Each of those streams has its own price, its own market and its own margin. Model them as a single revenue line and you lose the one thing that makes these projects work: the ability to shift the product mix as prices move.
This ethanol plant financial model was built to hold all three. It helps you assess the financial viability of setting up and operating an ethanol and sugar production project alongside a bagasse-fired power plant, capturing every essential input across construction, operation and financing — and resolving them into the metrics a developer, sponsor or lender needs to reach a decision.
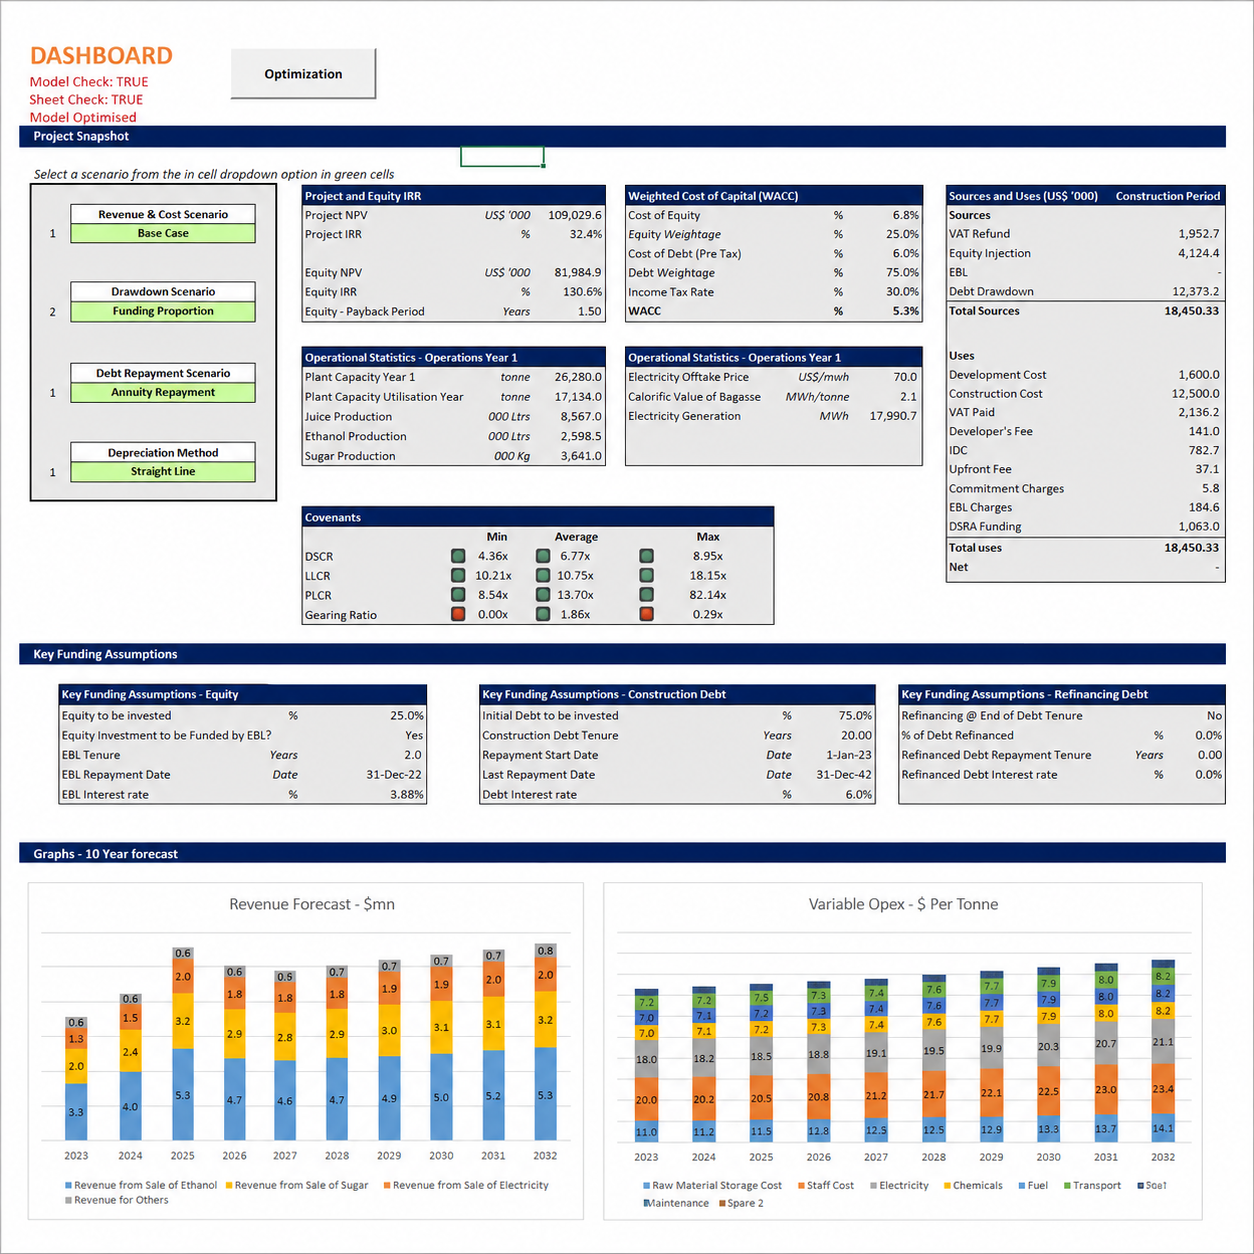
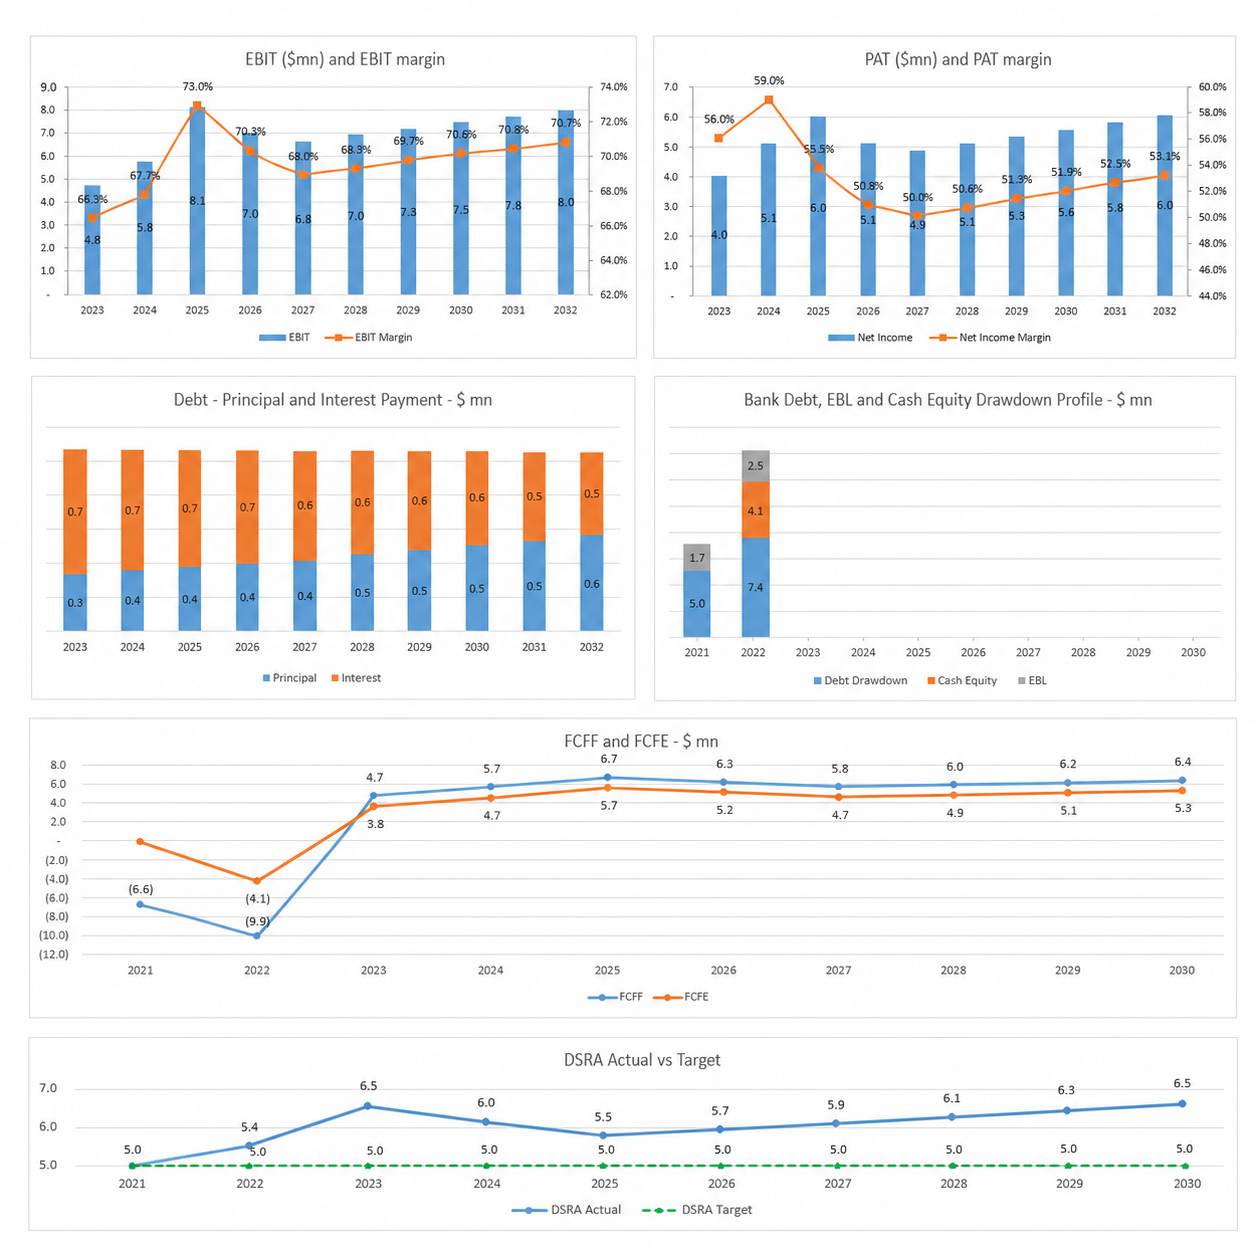
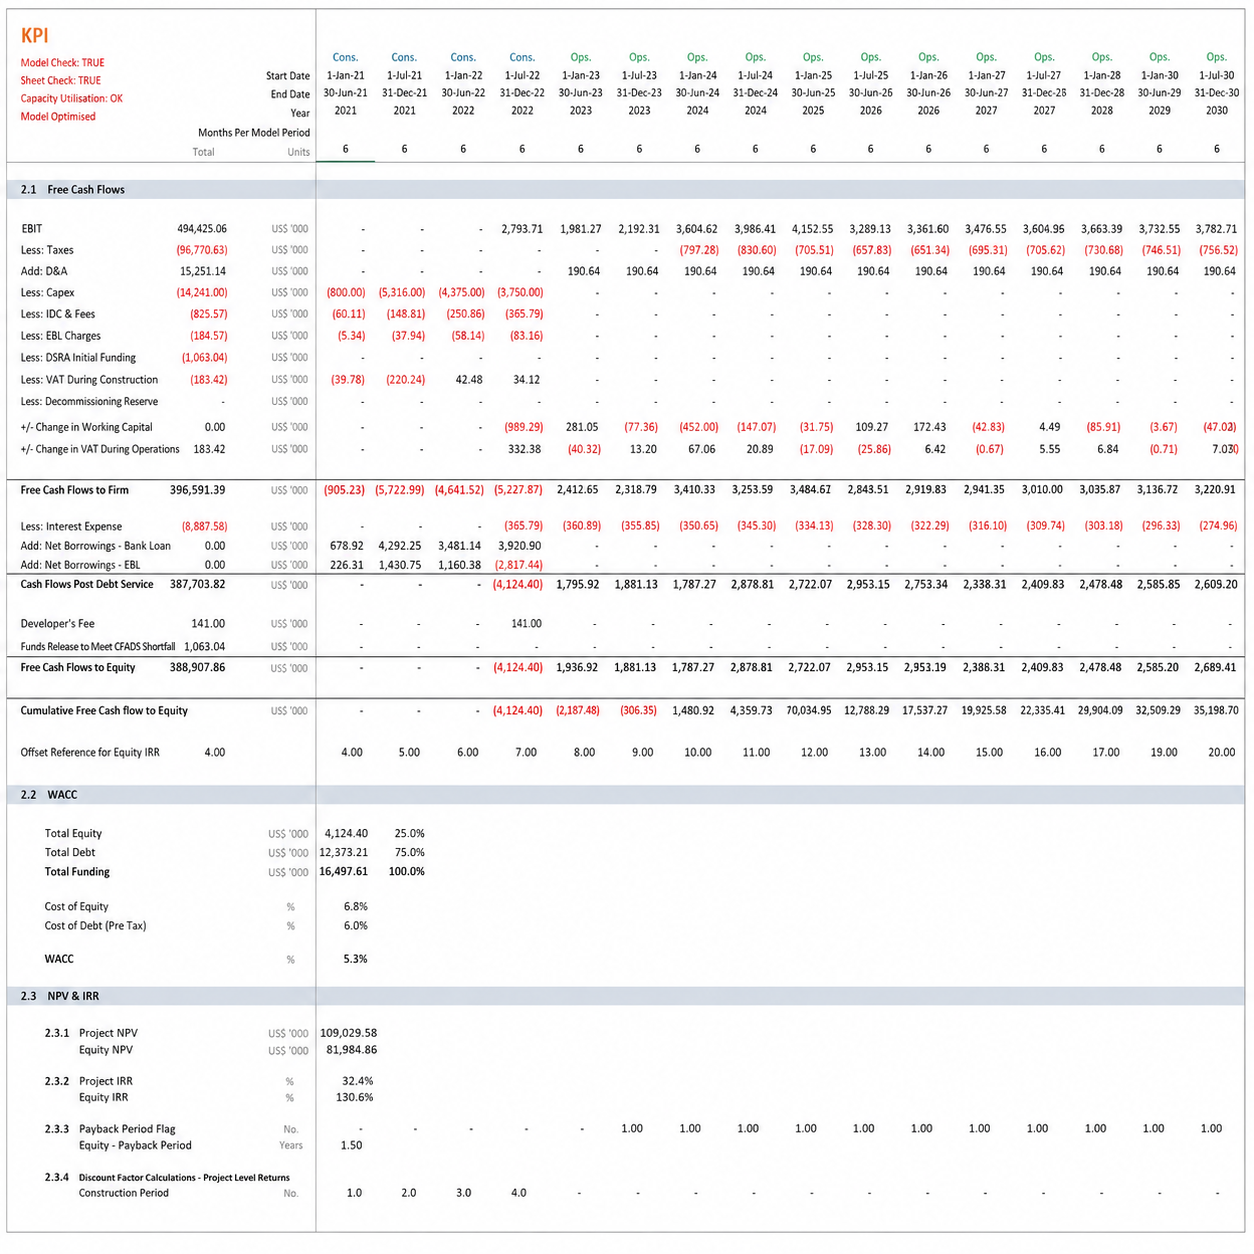
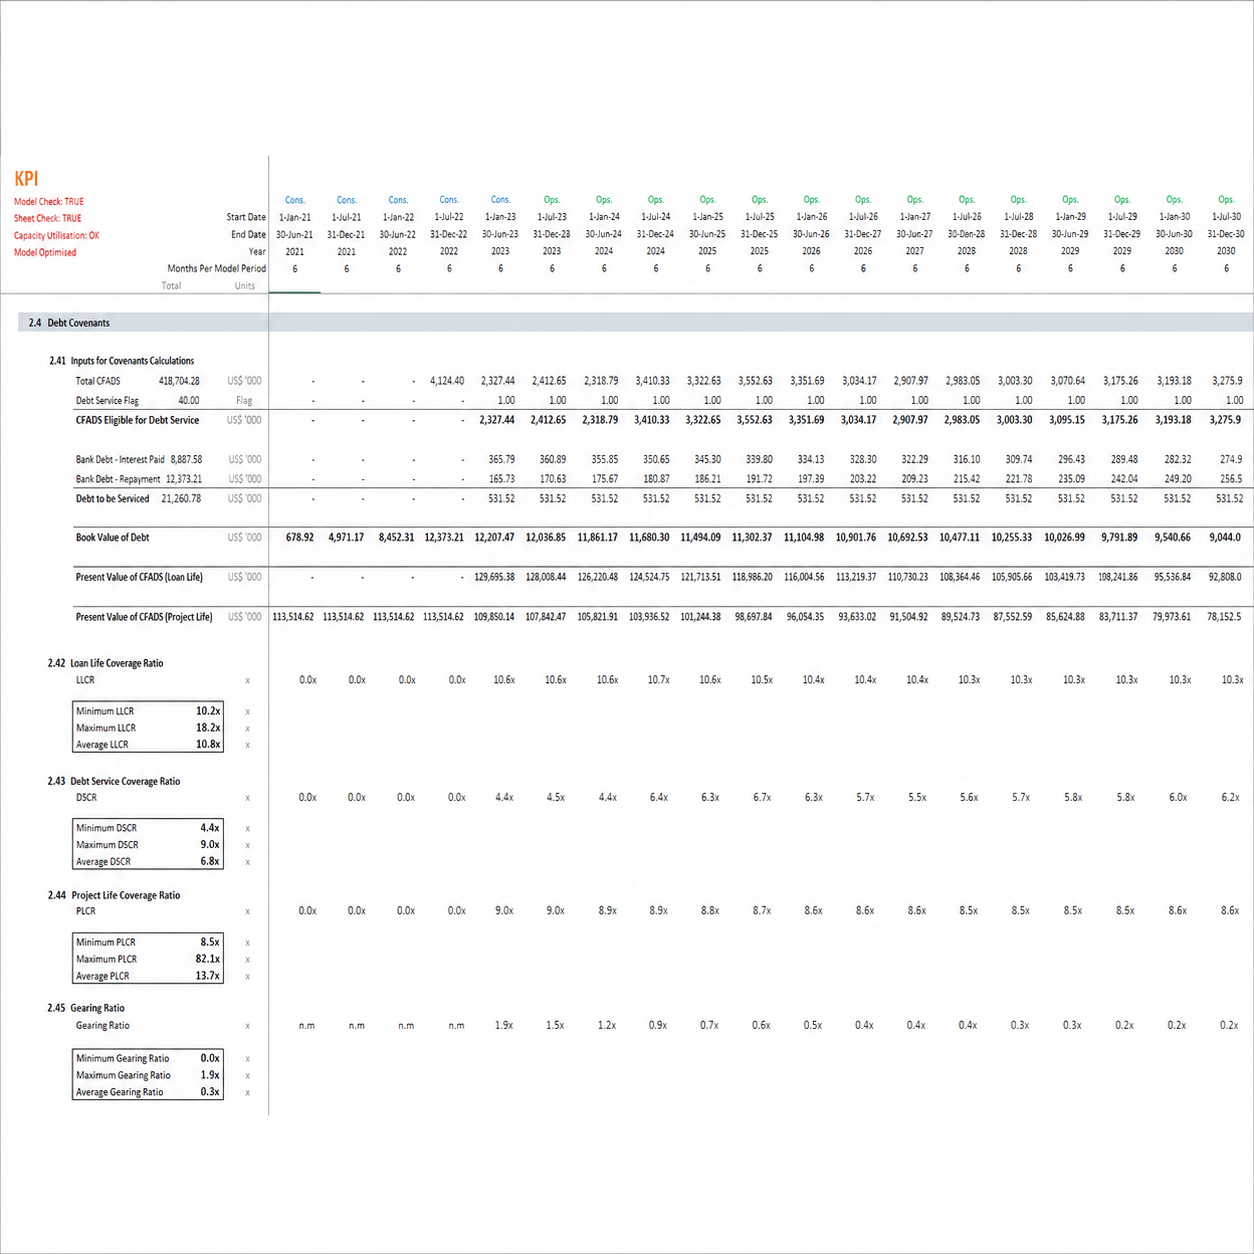
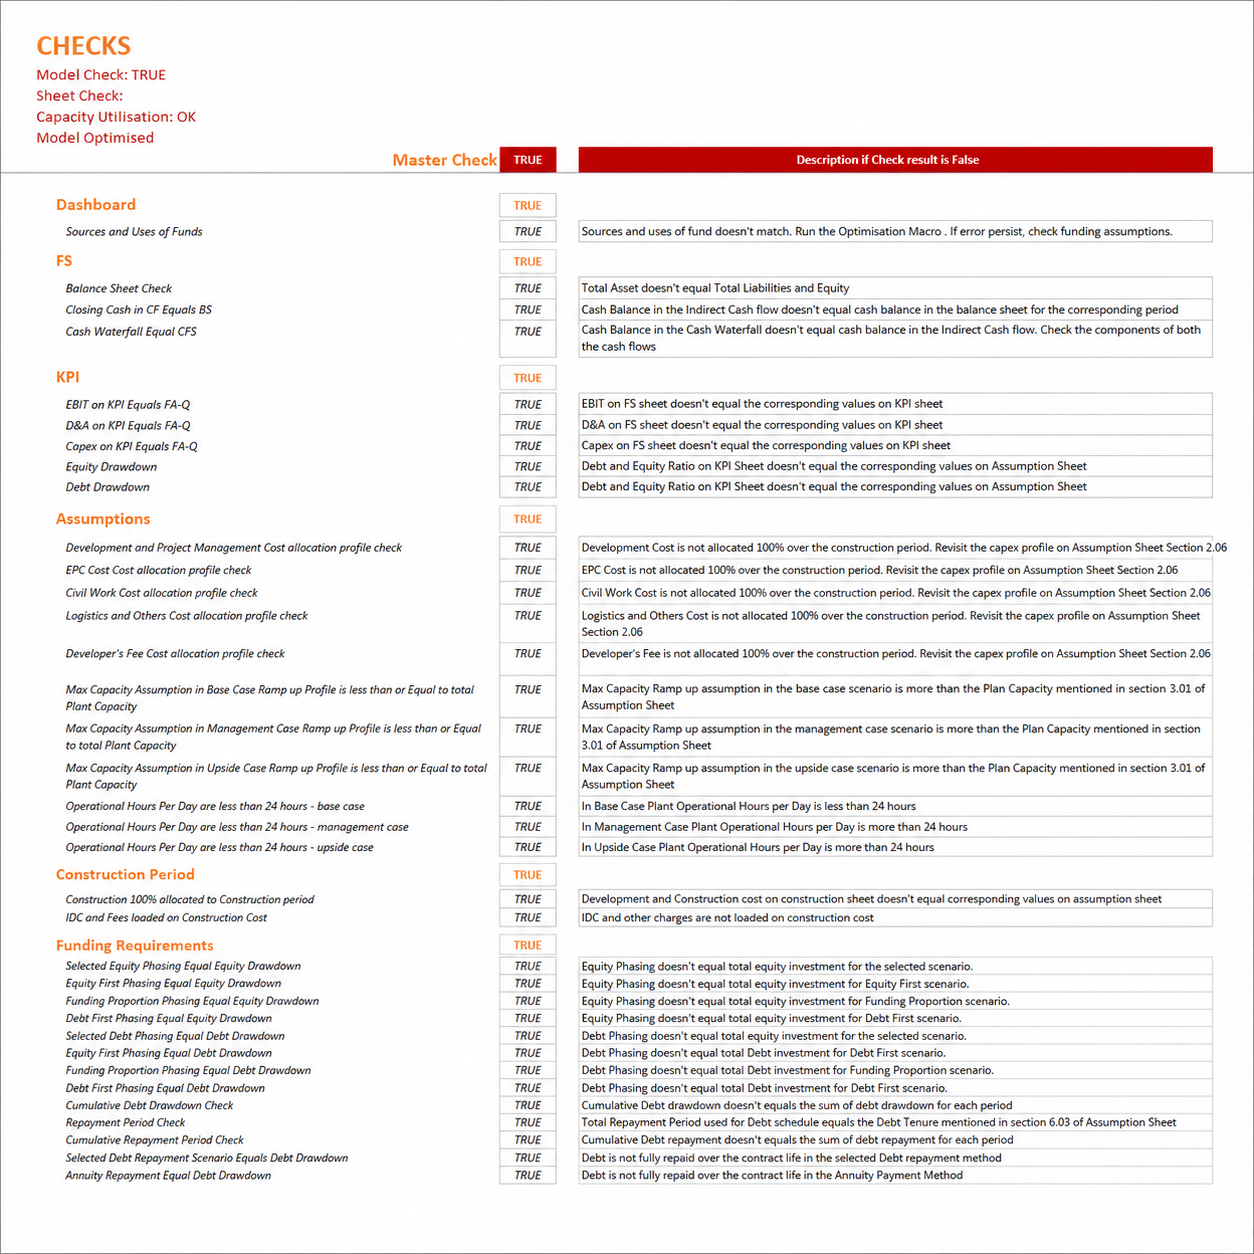
Because it follows project finance convention, the model produces the complete suite of bankability outputs — Project and Equity IRR and NPV, minimum and average DSCR, LLCR, PLCR, equity payback and a full cash waterfall — the numbers that decide whether a project reaches financial close.
Revenue in this ethanol plant financial model is built from sugarcane intake upward — plant processing capacity, raw material per month, conversion factor and storage capacity — then split across ethanol sales, sugar sales and electricity sales. Because the streams are modelled separately, you can test a swing toward ethanol when fuel prices rise, or toward sugar when they fall, and see the effect on returns immediately.
The onsite power plant deserves particular attention. Bagasse is a by-product that would otherwise be waste; converting it into saleable electricity turns a disposal problem into a third income stream, and often materially improves project economics. This model treats that revenue explicitly rather than folding it into an “other income” line.
Every driver of viability is an explicit, editable input. The assumptions cover:
| Development & Construction | Development cost, construction cost and developer’s fee |
| Plant & Feedstock | Processing capacity, sugarcane per month, conversion factor and storage capacity |
| Revenue Streams | Ethanol sales, sugar sales, electricity sales and other sources of revenue |
| Variable O&M | Cost of electricity, raw material storage, and O&M per tonne across eight subheads — staff, water, consumables, transport, fuel and more |
| Fixed Costs | SPV cost, insurance, land lease, community payment, management fee and more |
| Funding Profile | Cash equity, bridge loan, bank debt, DSRA and bank overdraft |
| Debt Repayment | Annuity, sculpted and even-principal options |
| Adjustments | Inflation and indexation, VAT during construction and operations, depreciation options, working capital and decommissioning reserve |
This is where the ethanol plant financial model earns its keep — resolving your assumptions into the full set of metrics a financing decision turns on:
The model separates construction and operation cleanly, and lets you set the length and granularity of each — monthly, quarterly, semi-annual or annual — independently. That matters here, because cane crushing is seasonal: a monthly operating view can capture the harvest cycle in a way an annual view simply cannot.
Every revenue and cost assumption can be entered across three scenarios and switched at a button. The debt funding drawdown carries three scenarios of its own — valuable when negotiating terms with financial institutions — and repayment can be profiled as annuity, even-principal or sculpted.
Bagasse-fired electricity sales sit as their own revenue stream, so the value of the onsite power plant is visible rather than buried.
Ethanol and sugar are separate drivers, so you can test a swing between them as commodity prices move.
Clearly defined input, calculation and output cells, with a colour-coded heat map so even a first-time user can navigate it.
New to these metrics? Read an overview of the debt service coverage ratio. For a model built to your own specification, see our project finance advisory services, or browse the full range of PPP and project finance templates.
Three revenue streams, construction and operation phases, a flexible timeline, three scenarios and every lender metric from Project IRR to LLCR — ready in Excel.