$99.00
A comprehensive financial analysis template that converts a company’s financial statements into more than 70 ratios across 12 categories — a complete read on financial health, in one Excel file.
Financial analysis is how you turn raw numbers into a judgement. It is used to evaluate trends, set financial policy, build long-term plans, and decide which companies or projects are worth backing. But the ratios that make that judgement possible are scattered across textbooks and half-remembered formulas. This template gathers them into one place and does the arithmetic for you.
Working from a bottom-up approach, it examines a company’s past and projected performance as investment indicators. You input the financial data; the template assesses overall financial health, works through the statements, and tracks key performance indicators over time — so you can make an informed decision rather than a rushed one.
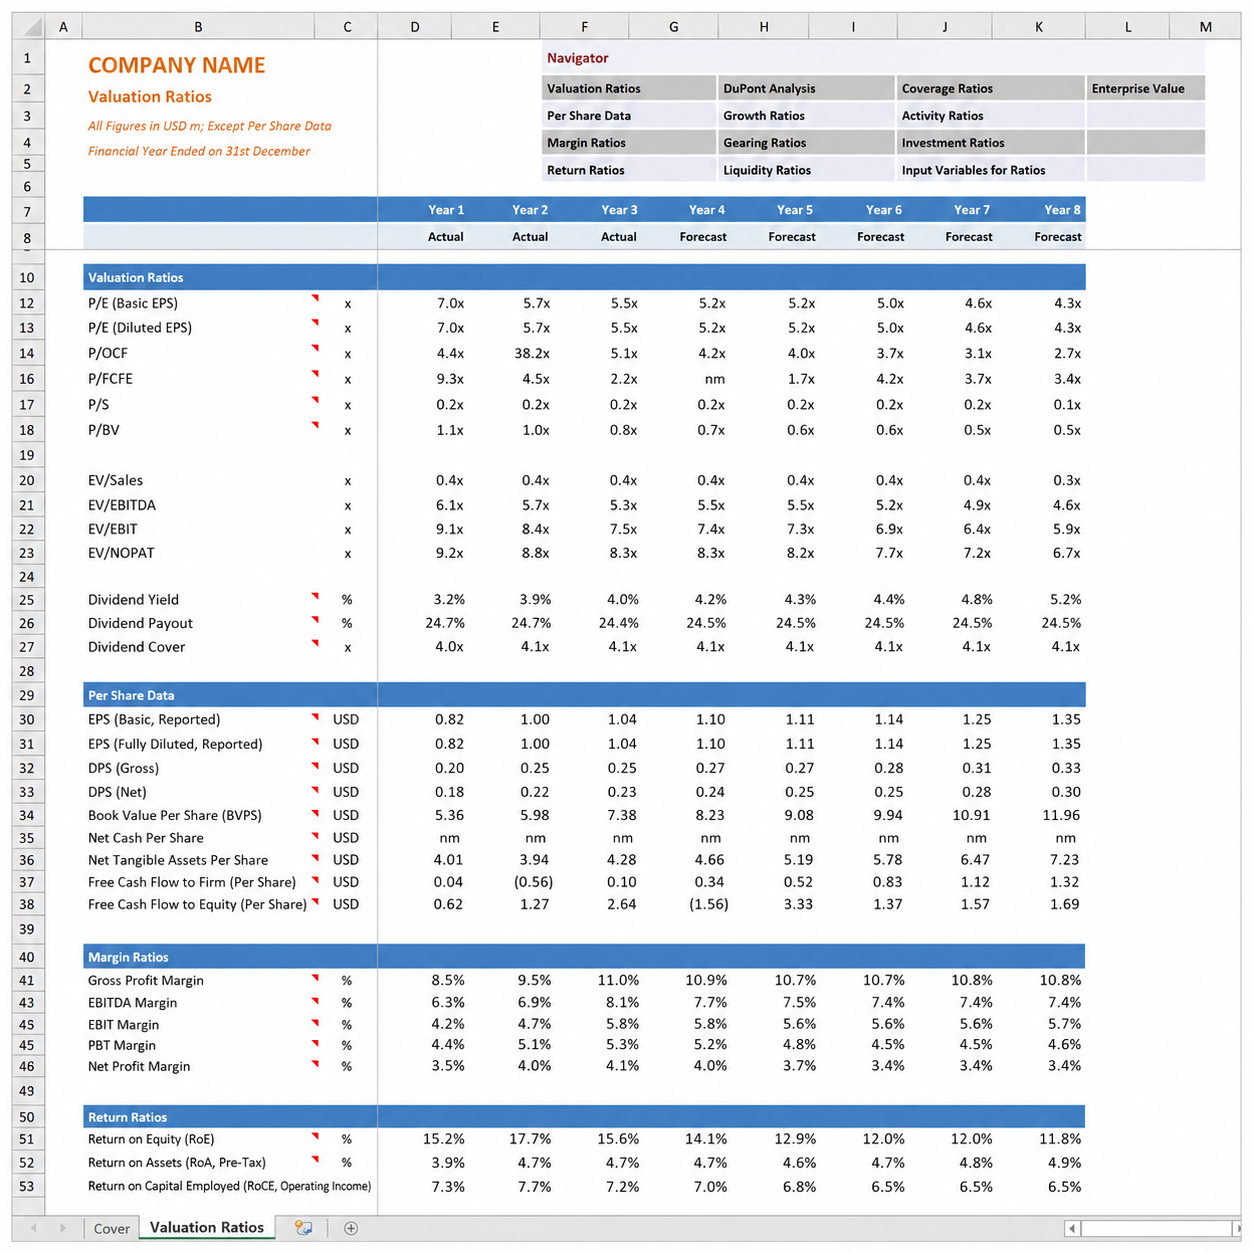
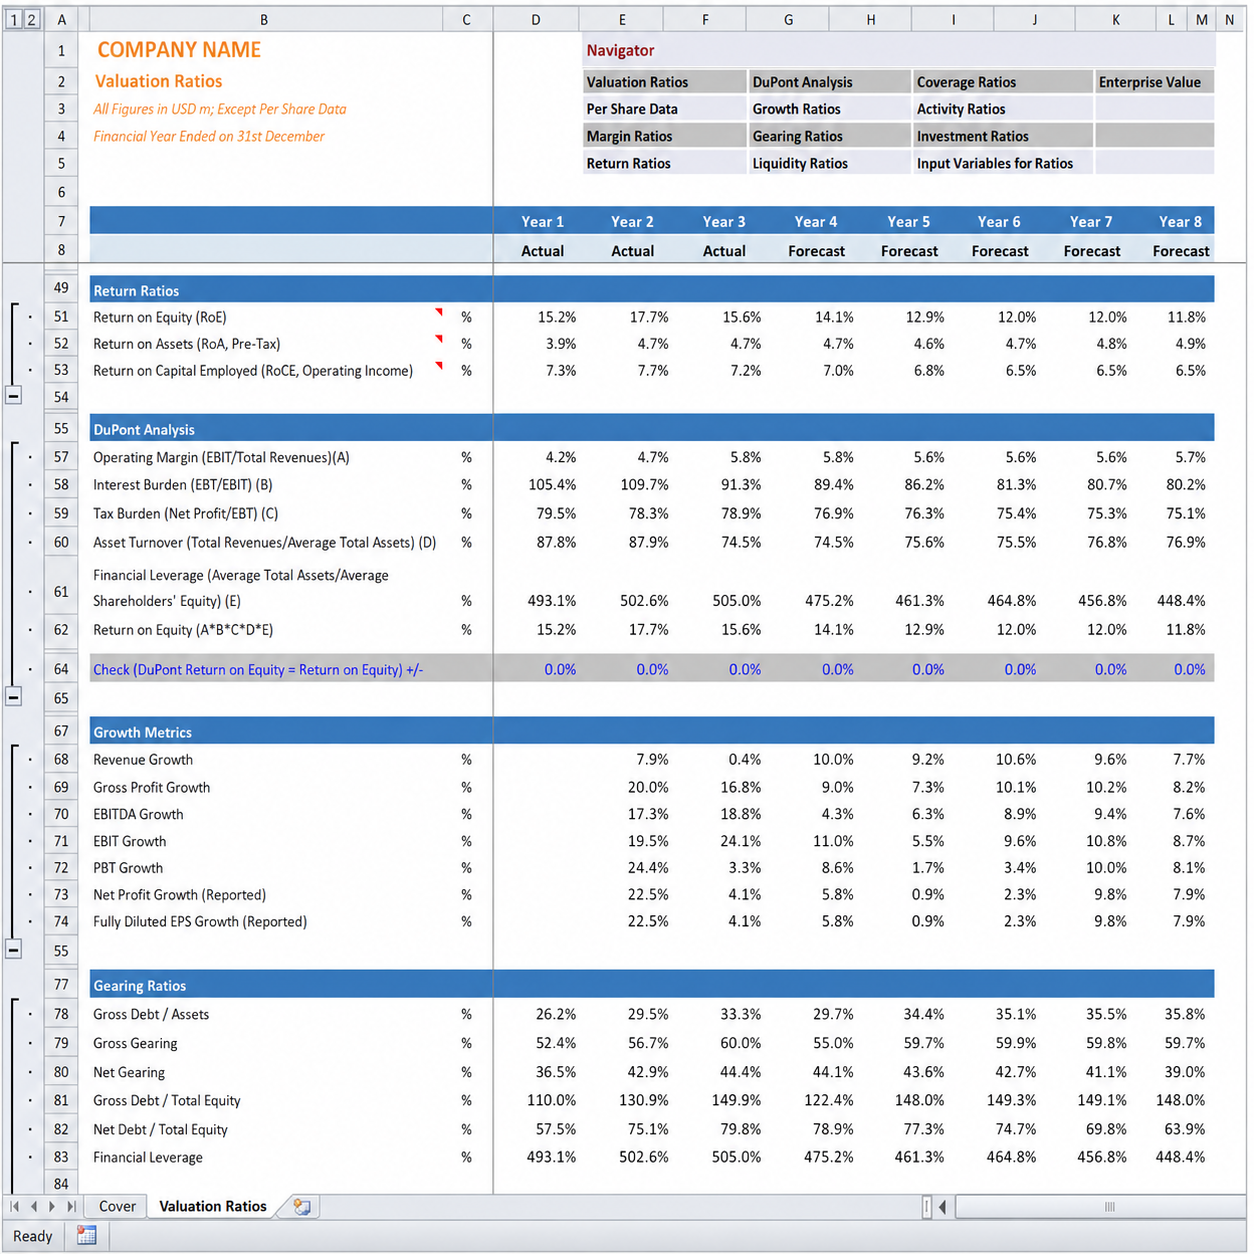
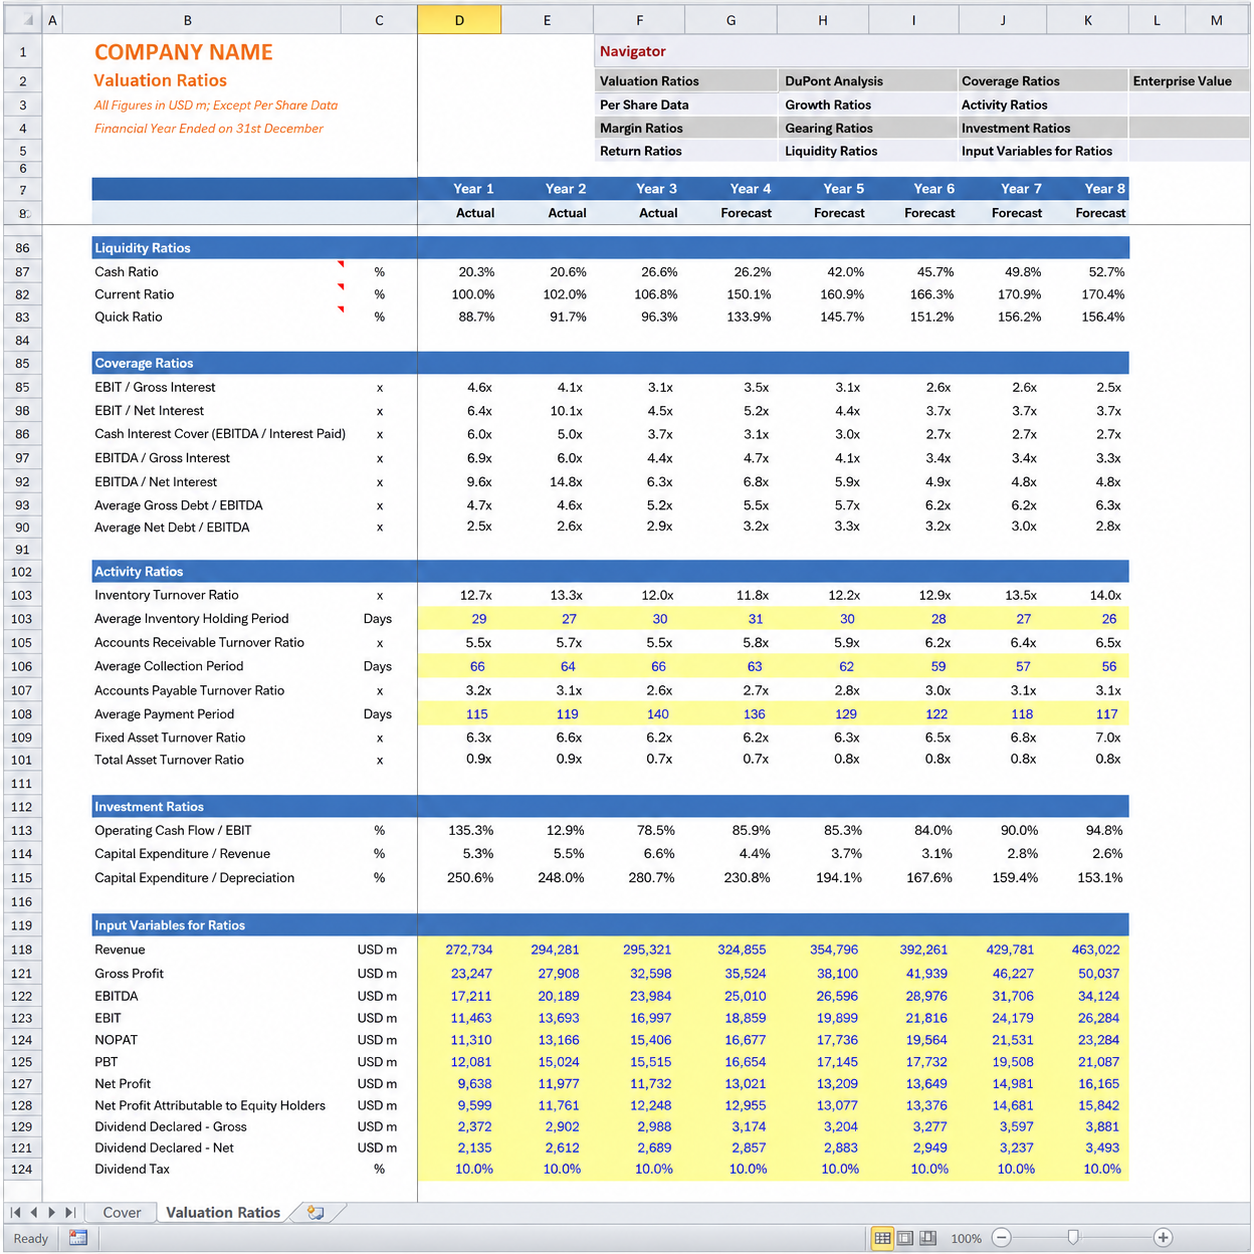
Enter a company’s numbers once, and the template generates over 70 financial ratios organised into 12 clear categories, each ready to read and compare.
Every angle a serious analyst looks at, grouped so you can move straight to what you need:
| Valuation Ratios | P/E, P/FCFF, P/BV, EV/EBITDA, EV/EBIT and more |
| Per Share Data | EPS, BPS, DPS, FCFF, FCFE and more |
| Margin Ratios | Gross, EBITDA, EBIT, PBT and PAT margins |
| Return Ratios | RoCE, RoE, RoA |
| DuPont Analysis | ROE decomposed into its operating, efficiency and leverage drivers |
| Growth Metrics | Revenue growth, EBITDA growth, EBIT growth and more |
| Gearing Ratios | Gross debt/assets, gross and net gearing, financial leverage and more |
| Liquidity Ratios | Cash, current and quick ratios |
| Coverage Ratios | EBIT/gross interest, cash interest cover, average gross debt/EBITDA, EBITDA/net interest and more |
| Activity Ratios | Inventory turnover, receivable turnover, payable turnover |
| Investment Ratios | Operating cash flow/EBIT, capex/revenue, capex/depreciation |
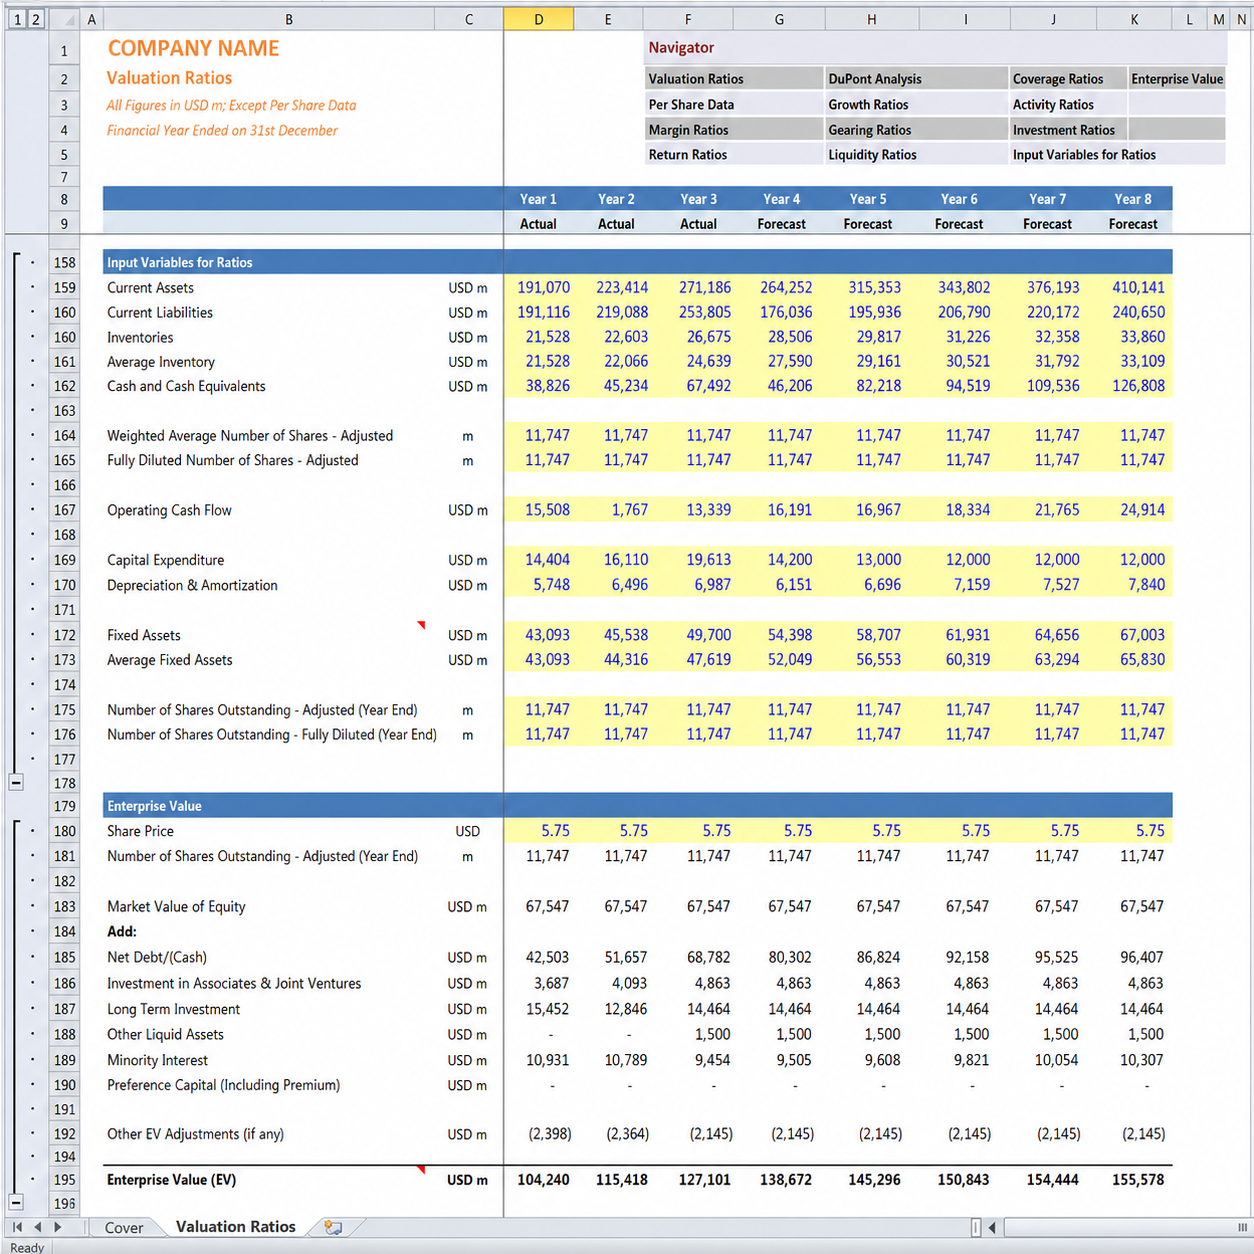
| Enterprise Value | A clean bridge to the company’s total value |
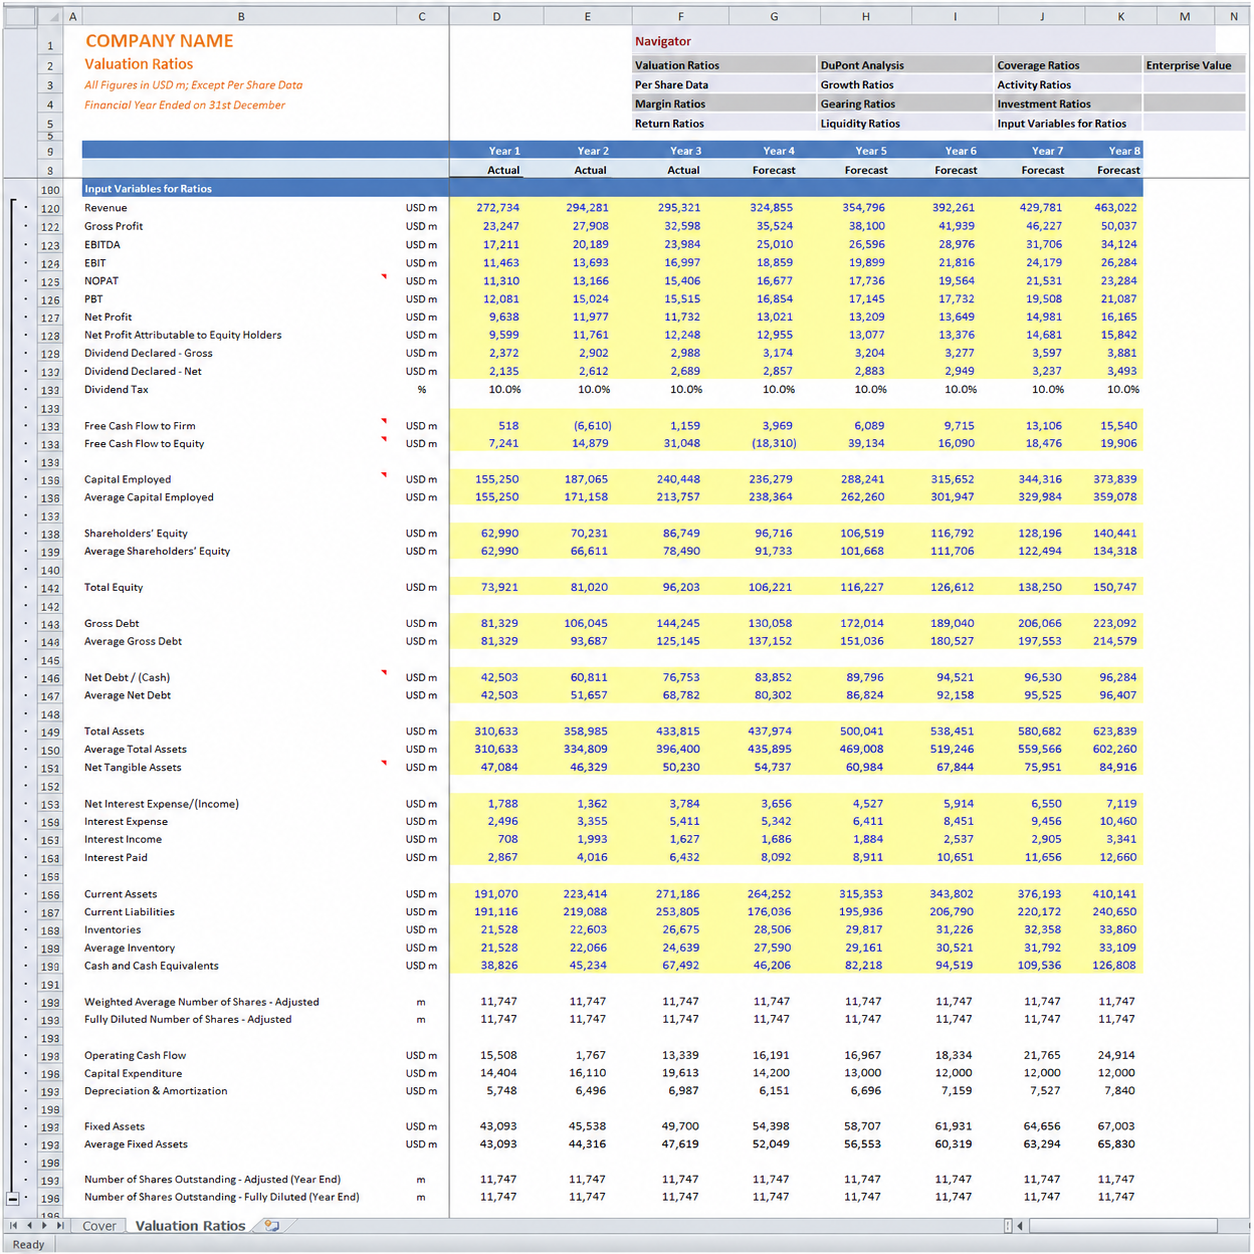
The template is input-driven and straightforward. You enter a company’s financial data — from its statements, past and projected — and the ratios populate automatically. Because the analysis is built on your figures, it works for any company in any sector: a listed business you are researching, a private target you are diligencing, or your own company measured over time.
The value is in the completeness. Rather than calculating a handful of ratios and hoping they tell the story, you get the full picture — valuation, profitability, returns, leverage, liquidity and efficiency — side by side, so patterns and warning signs are easy to spot.
The full analytical toolkit in a single template, so nothing important gets left out of your assessment.
Sector-agnostic and input-driven — analyse a listed firm, a private target or your own business.
Every ratio is calculated in plain view, so you can trace exactly how each number is built.
Pair this with a full valuation from our DCF valuation templates, or talk to us about financial advisory services.
70+ ratios across 12 categories, generated from your inputs — valuation, margins, returns, gearing, liquidity and more, in one Excel template.